Fig. 2
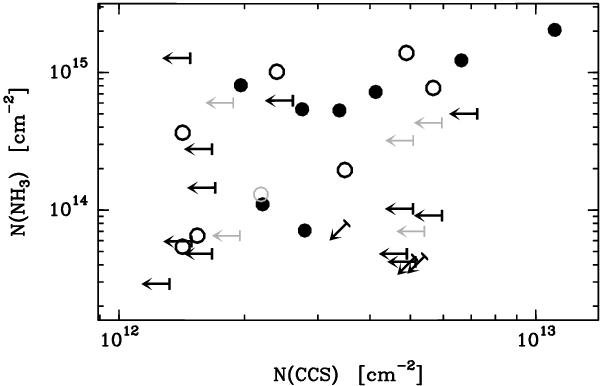
Column densities of NH3 versus CCS. Arrows indicate upper limits; filled and open circles represent objects with evidence of ongoing star formation (group 0 and I) and no signs of current star formation (group −I), respectively. Grey symbols denote sources with an uncertain evolutionary group (given in brackets in Table 2).
Current usage metrics show cumulative count of Article Views (full-text article views including HTML views, PDF and ePub downloads, according to the available data) and Abstracts Views on Vision4Press platform.
Data correspond to usage on the plateform after 2015. The current usage metrics is available 48-96 hours after online publication and is updated daily on week days.
Initial download of the metrics may take a while.