Free Access
Fig. 2
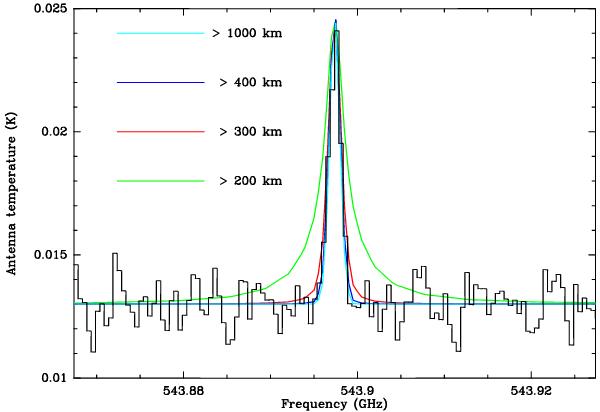
Models of the HNC(6–5) line, assuming an uniform mixing ratio distribution of HNC above altitudes of 1000, 400, 300, and 200 km, corresponding to cases A, G, H, and I, respectively, in Table 2. These models are compared with the averaged WBS spectrum from June/Dec.
Current usage metrics show cumulative count of Article Views (full-text article views including HTML views, PDF and ePub downloads, according to the available data) and Abstracts Views on Vision4Press platform.
Data correspond to usage on the plateform after 2015. The current usage metrics is available 48-96 hours after online publication and is updated daily on week days.
Initial download of the metrics may take a while.