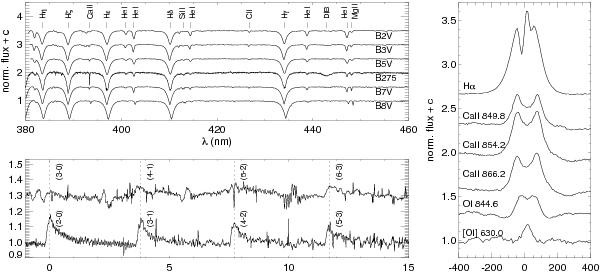
Fig. 1

Top left: the blue spectrum of B275 in M 17 shown next to B main-sequence-star spectra (Gray & Corbally 2009). Bottom left: the 1st and 2nd overtone CO emission bands. Zero velocity corresponds to the first component in the series (at 2294 and 1558 nm, respectively). Right: a sample of the emission line profiles in the spectrum of B275. The Ca ii triplet lines and O i 845 nm are superposed on hydrogen Paschen series absorption lines. The flux of the Hα line is scaled down by a factor 5; the structure near the peak is a remnant of the nebular-line subtraction.
Current usage metrics show cumulative count of Article Views (full-text article views including HTML views, PDF and ePub downloads, according to the available data) and Abstracts Views on Vision4Press platform.
Data correspond to usage on the plateform after 2015. The current usage metrics is available 48-96 hours after online publication and is updated daily on week days.
Initial download of the metrics may take a while.


