Fig. 8
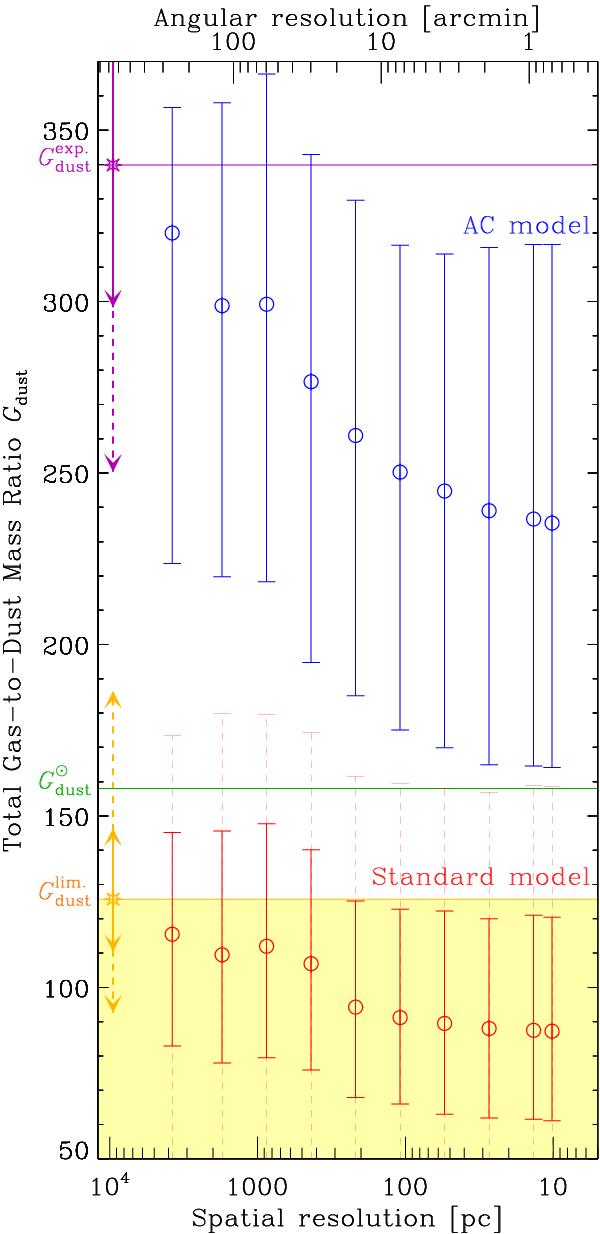
Consistency of the gas-to-dust mass ratios. The two trends show the gas-to-dust
mass ratio as a function of the spatial resolution, for each model. We also
display the 90% confidence interval for the “standard model”,
with dashed lines. The yellow and purple error bars, with the star symbol,
represent the uncertainities on  and
and  ,
respectively (Table 5; solid line: 50%;
dashed line: 90%). The purple, green and yellow solid lines show the central
values of ,
,
respectively (Table 5; solid line: 50%;
dashed line: 90%). The purple, green and yellow solid lines show the central
values of ,
 and
,
respectively. The yellow filled area represents the gas-to-dust mass ratio range
below the central value of the limit ratio .
and
,
respectively. The yellow filled area represents the gas-to-dust mass ratio range
below the central value of the limit ratio .
Current usage metrics show cumulative count of Article Views (full-text article views including HTML views, PDF and ePub downloads, according to the available data) and Abstracts Views on Vision4Press platform.
Data correspond to usage on the plateform after 2015. The current usage metrics is available 48-96 hours after online publication and is updated daily on week days.
Initial download of the metrics may take a while.