Fig. 6
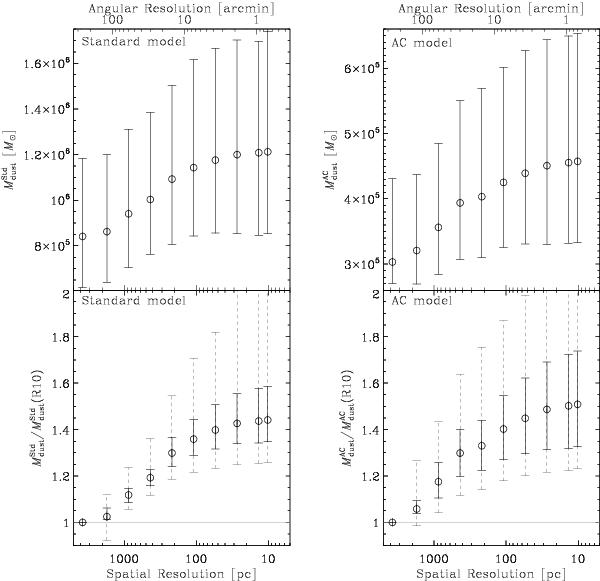
Trend of the total dust mass with spatial resolution. The left panels show the trends for the “standard model”, while the right panels show the trends for the “AC model”. For each panel, the x-axis is the spatial resolution of the maps used to derive the dust mass. Each point of the trends corresponds to one of the maps listed in Table 1. For the two top panels, the y-axis is the total dust mass. This mass is the sum of the dust mass of each pixel. For each resolution, there are as many SED fits as the number of pixels listed in Table 1. The two bottom panels show the relative dust mass variation. It is normalized by the integrated strip (R10). In that way, the calibration errors cancel, and the trend has smaller error bars. The dashed error bars display the 90% confidence interval.
Current usage metrics show cumulative count of Article Views (full-text article views including HTML views, PDF and ePub downloads, according to the available data) and Abstracts Views on Vision4Press platform.
Data correspond to usage on the plateform after 2015. The current usage metrics is available 48-96 hours after online publication and is updated daily on week days.
Initial download of the metrics may take a while.