Fig. 2
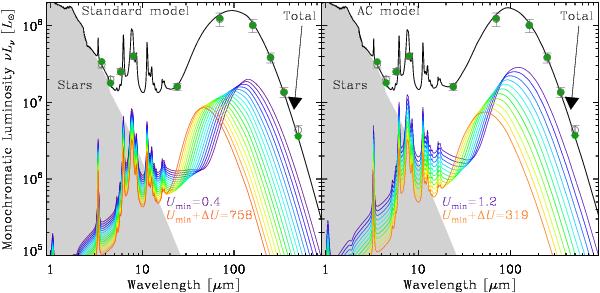
Decomposition of the integrated strip SED into the individual uniformly illuminated
SEDs. The grey circles and error bars are the integrated observed fluxes of R10
(Table 1). The total model (black line;
Eq. (7)) is the sum of the
independent stellar component (grey filled area), and of the integral of uniformly
illuminated dust SEDs (in colors; Eq. (4)). There is linear gradation in U between colors for
the uniformly illuminated SEDs. The starlight intensity U is in
units of 2.2 × 10⁻⁵ W m-2. The sum of these components is the
black line. The green dots are the synthetic photometry (i.e. the model integrated
in each instrumental filter). The left panel shows the
“standard model”, while the right panel shows
the “AC model”. To quantify the quality of the fits, the reduced
chi square is  for the
“standard model” and
for the
“standard model” and  for the “AC
model”.
for the “AC
model”.
Current usage metrics show cumulative count of Article Views (full-text article views including HTML views, PDF and ePub downloads, according to the available data) and Abstracts Views on Vision4Press platform.
Data correspond to usage on the plateform after 2015. The current usage metrics is available 48-96 hours after online publication and is updated daily on week days.
Initial download of the metrics may take a while.