Fig. 14
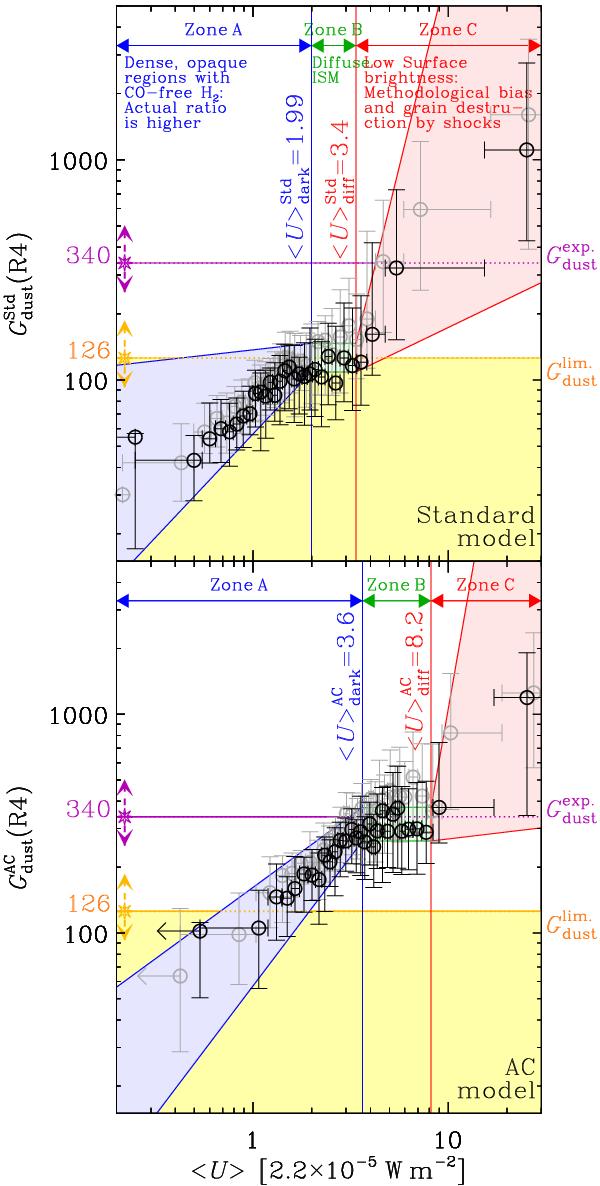
Definition of the various zones for the two models, for R4 (54 pc). Each panel
shows the binned trends of the right panels of Fig. 13 (grey circles with error bars). The fitted trend (black symbols with
error bars) is the grey trend corrected for the offset
 (Table 8). We define the three zones
depending on their starlight intensities. Each zone corresponds to a different
regime of the observed gas-to-dust mass ratio. The blue-green-red stripes are the
envelopes of the fits of Eq. (25)
to the trend. The yellow and purple dashed error bars, with the star symbol,
represent the 90% confidence uncertainities on
(Table 8). We define the three zones
depending on their starlight intensities. Each zone corresponds to a different
regime of the observed gas-to-dust mass ratio. The blue-green-red stripes are the
envelopes of the fits of Eq. (25)
to the trend. The yellow and purple dashed error bars, with the star symbol,
represent the 90% confidence uncertainities on
 and
and  ,
respectively (Table 5). This complex figure
is explained in details in Sect. 4.3.6.
,
respectively (Table 5). This complex figure
is explained in details in Sect. 4.3.6.
Current usage metrics show cumulative count of Article Views (full-text article views including HTML views, PDF and ePub downloads, according to the available data) and Abstracts Views on Vision4Press platform.
Data correspond to usage on the plateform after 2015. The current usage metrics is available 48-96 hours after online publication and is updated daily on week days.
Initial download of the metrics may take a while.