Fig. 13
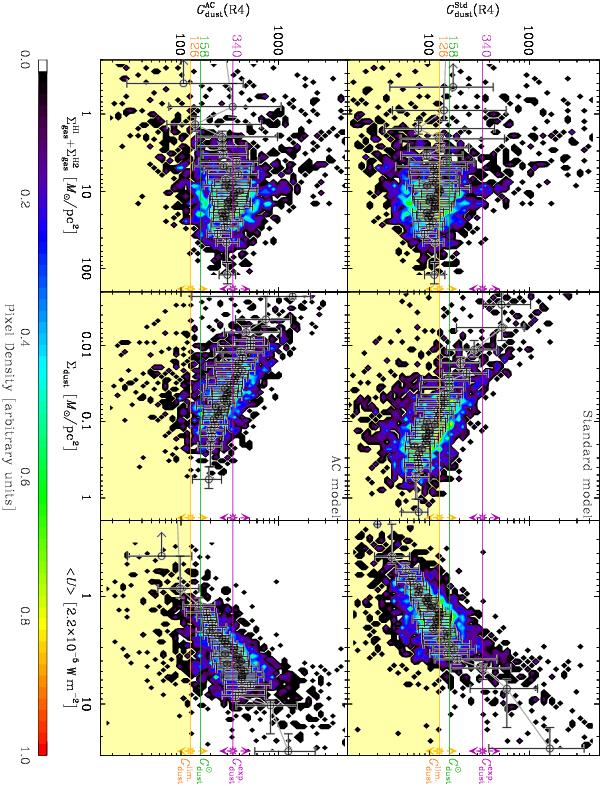
Pixel-to-pixel correlations between various tracers of the physical conditions
and the gas-to-dust mass ratio. Results are shown for the two models, at spatial
resolution R4. The color scale represents the density of pixels in various bins of
the two parameters. The overplotted grey error bars are the trends binned over the
x-axis parameter. The bin size is defined so that the same
number of pixels falls within each bin. That is the reason why the bins are very
narrow in the center, and there are only a few points in the outer parts where the
pixel density is low. The central value is the median gas-to-dust mass ratio, and
the error bars account for the pixel-to-pixel scatter, which is similar to or
larger than the typical intrinsic error bar of a single pixel. The yellow and
purple dashed error bars, with the star symbol, represent the 90% confidence
uncertainities on  and
and  ,
respectively (Table 5). This complex figure
is explained in details in Sect. 4.3.5.
,
respectively (Table 5). This complex figure
is explained in details in Sect. 4.3.5.
Current usage metrics show cumulative count of Article Views (full-text article views including HTML views, PDF and ePub downloads, according to the available data) and Abstracts Views on Vision4Press platform.
Data correspond to usage on the plateform after 2015. The current usage metrics is available 48-96 hours after online publication and is updated daily on week days.
Initial download of the metrics may take a while.