Fig. 11
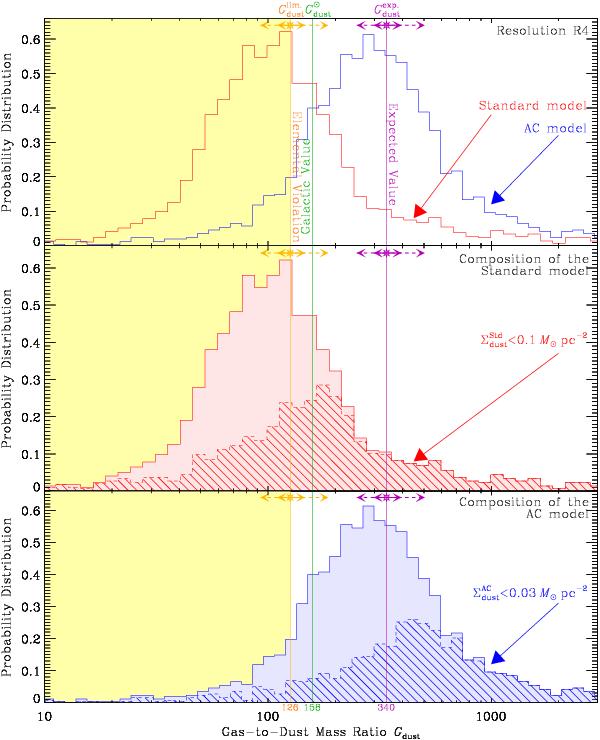
Pixel-to-pixel distribution of the gas-to-dust mass ratio for R4 (54 pc). The two
histograms of the top panel are the pixel probability
distribution of the gas-to-dust mass ratio for the two models. The spread of the
distribution reflects the pixel to pixel spread fluctuations of the ratio. The
actual error on the total Gdust is smaller than this
spread (Table 7). For comparison, we show
the values of  (Eq. (20)),
 (Eq. (15)), and
 (Eq. (22)). In the two
lower panels, each histogram is repeated and is decomposed according to
its dust mass surface density. The hatched components correspond to lower surface
densities (below the arbitrary limit indicated in each panel). The yellow and
purple error bars, with the star symbol, represent the uncertainities on
and ,
respectively (Table 5; solid line: 50%;
dashed line: 90%).
(Eq. (22)). In the two
lower panels, each histogram is repeated and is decomposed according to
its dust mass surface density. The hatched components correspond to lower surface
densities (below the arbitrary limit indicated in each panel). The yellow and
purple error bars, with the star symbol, represent the uncertainities on
and ,
respectively (Table 5; solid line: 50%;
dashed line: 90%).
Current usage metrics show cumulative count of Article Views (full-text article views including HTML views, PDF and ePub downloads, according to the available data) and Abstracts Views on Vision4Press platform.
Data correspond to usage on the plateform after 2015. The current usage metrics is available 48-96 hours after online publication and is updated daily on week days.
Initial download of the metrics may take a while.