Fig. 4
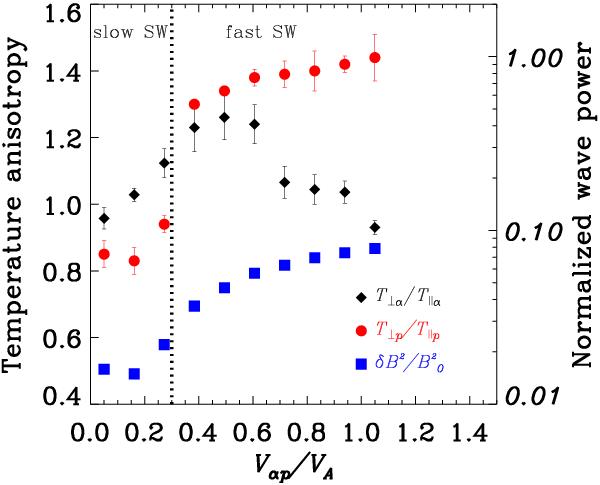
Left ordinate: the mean values of the temperature anisotropy of the protons, T⊥p/T∥p (red dots), and of the alpha particles, T⊥α/T∥α (black diamonds). Right ordinate: mean normalized wave power (blue squares). The bars indicate the uncertainties of the mean values. All quantities are plotted in bins versus the relative ion differential speed, Vαp/VA. The vertical dotted line separates fast from slow solar wind regimes.
Current usage metrics show cumulative count of Article Views (full-text article views including HTML views, PDF and ePub downloads, according to the available data) and Abstracts Views on Vision4Press platform.
Data correspond to usage on the plateform after 2015. The current usage metrics is available 48-96 hours after online publication and is updated daily on week days.
Initial download of the metrics may take a while.