Fig. 3
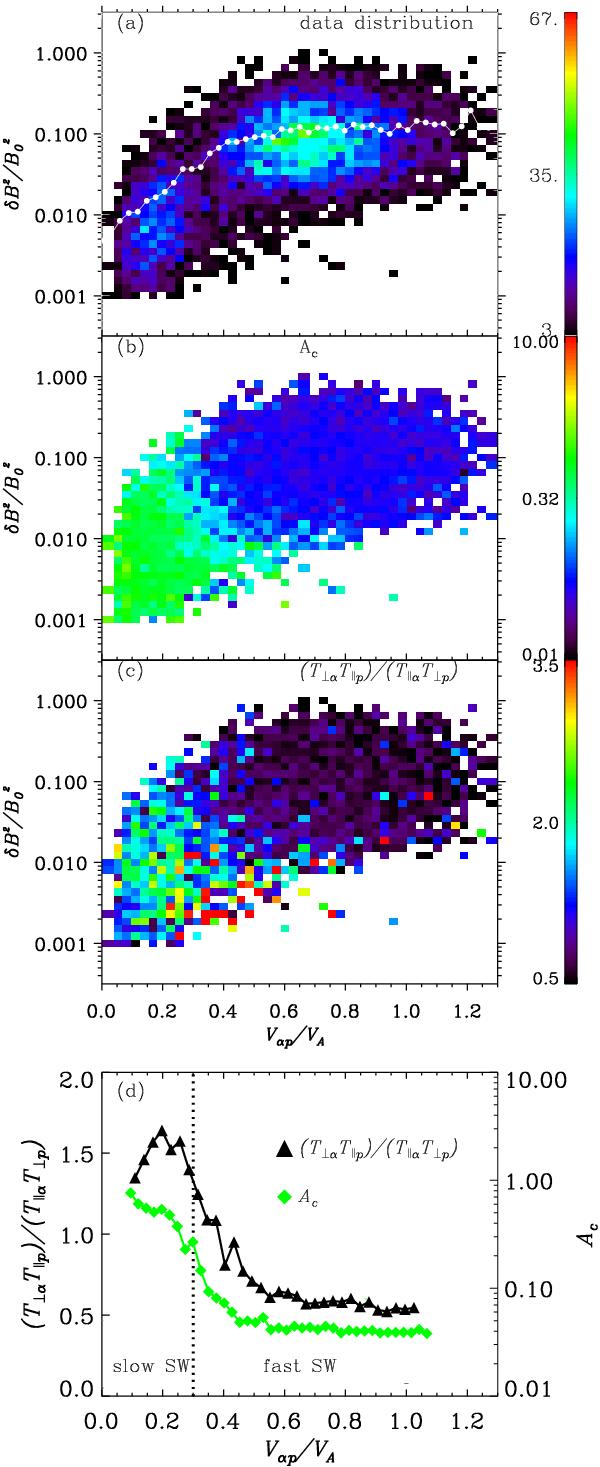
Distributions (presented in colour with coding indicated by the right-hand bars) of the number of our data a), the collision age, Ac b) and the ratio between the temperature anisotropies of alpha particles and protons, (T⊥αT∥p)/(T∥αT⊥p), c). All parameter are plotted in the plane of the normalized wave-power,  , versus normalized ion differential speed, Vαp/VA; d) weighted mean values of the collisional age, Ac, and the ratio between the temperature anisotropies of alpha particles and protons, (T⊥αT∥p)/(T∥αT⊥p), displayed versus normalized ion differential speed, Vαp/VA. The white dots in panel a) represent the weighted mean values. The vertical dotted line in panel d) separates the regimes of fast and slow solar wind.
Current usage metrics show cumulative count of Article Views (full-text article views including HTML views, PDF and ePub downloads, according to the available data) and Abstracts Views on Vision4Press platform.
Data correspond to usage on the plateform after 2015. The current usage metrics is available 48-96 hours after online publication and is updated daily on week days.
Initial download of the metrics may take a while.