Fig. 2
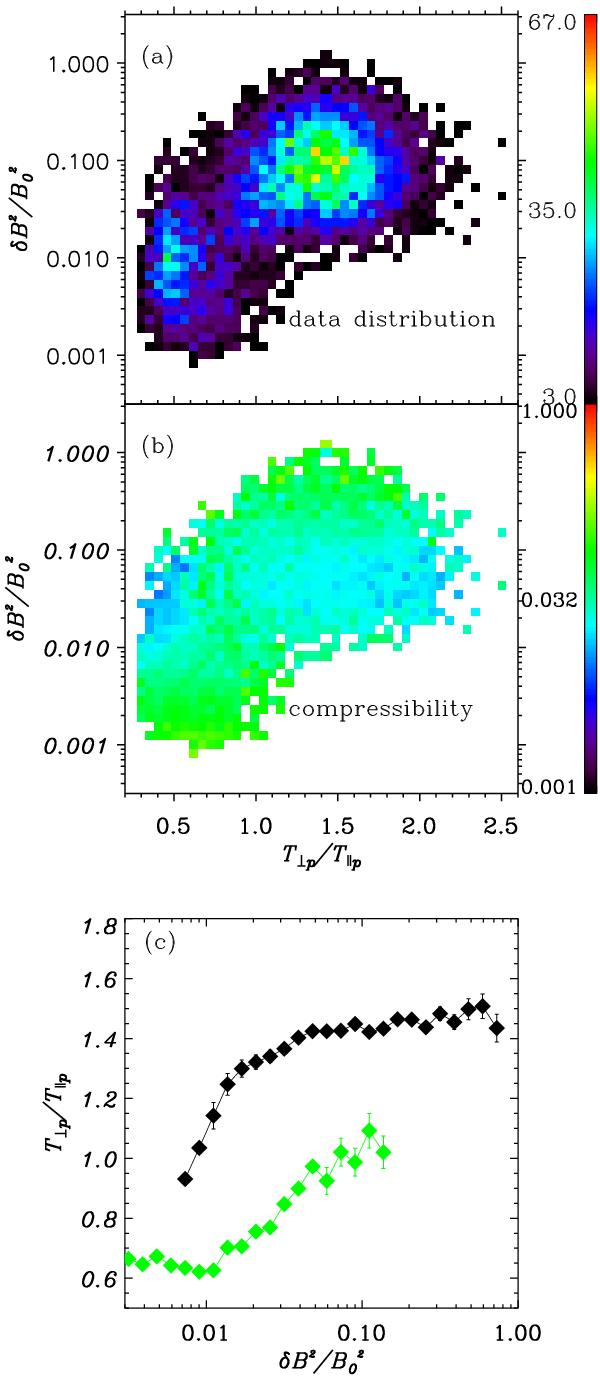
Distributions (presented in colour with coding indicated by the right-hand bars) of the number of our data a) and the compressibility,  b) plotted in the parameter plane of the normalized wave power versus the proton temperature anisotropy, T⊥p/T∥p; c) weighted mean value of the proton temperature anisotropy for Ac < 0.1 (black), and Ac > 0.2 (green) displayed versus normalized wave power. The short vertical bars indicate the small uncertainties of the weighted mean values.
Current usage metrics show cumulative count of Article Views (full-text article views including HTML views, PDF and ePub downloads, according to the available data) and Abstracts Views on Vision4Press platform.
Data correspond to usage on the plateform after 2015. The current usage metrics is available 48-96 hours after online publication and is updated daily on week days.
Initial download of the metrics may take a while.