| Issue |
A&A
Volume 536, December 2011
|
|
|---|---|---|
| Article Number | L4 | |
| Number of page(s) | 5 | |
| Section | Letters | |
| DOI | https://doi.org/10.1051/0004-6361/201117797 | |
| Published online | 06 December 2011 | |
Letter to the Editor
Herschel discovery of a new class of cold, faint debris discs⋆
1
Dpt. Física Teórica, Facultad de Ciencias, Universidad Autónoma de Madrid, Cantoblanco, 28049 Madrid, Spain
e-mail: This email address is being protected from spambots. You need JavaScript enabled to view it.
2
ESA-ESAC Gaia SOC, PO Box 78, 28691 Villanueva de la Cañada, Madrid, Spain
3
Astrophysikalisches Institut und Universitätssternwarte, Friedrich-Schiller-Universität, Schillergäßchen 2-3, 07745 Jena, Germany
4
Dpt. de Astrofísica, Centro de Astrobiología (INTA-CSIC), ESAC Campus, PO Box 78, 28691 Villanueva de la Cañada, Madrid, Spain
5
Institut d’Astrophysique et de Géophysique, Université de Liege, 17 Allée du Six Août, 4000 Sart Tilman, Belgium
6
NASA Herschel Science Center, California Institute of Technology, 1200 E. California Blvd., Pasadena, CA 91125, USA
7
Université Joseph Fourier/CNRS, Laboratoire d’Astrophysique de Grenoble, UMR 5571, Grenoble, France
8
European Space Observatory, Alonso de Cordova 3107, Vitacura, Casilla 19001, Santiago 19, Chile
9
NASA Goddard Space Flight Center, Exoplanets and Stellar Astrophysics, Code 667, Greenbelt, MD 20771, USA
10
UNINOVA-CA3, Campus da Caparica, Quinta da Torre, Monte de Caparica, 2825-149 Caparica, Portugal
11
Christian-Albrechts-Universität zu Kiel, Institut für Theoretische Physik und Astrophysik, Leibnizstr. 15, 24098 Kiel, Germany
12
ESA Astrophysics & Fundamental Physics Missions Division, ESTEC/SRE-SA, Keplerlaan 1, 2201 AZ Noordwijk, The Netherlands
13
INSA at ESAC, 28691 Villanueva de la Cañada, Madrid, Spain
14
Onsala Space Observatory, Chalmers University of Technology, 439 92 Onsala, Sweden
15
Universidad Complutense de Madrid, Facultad de Ciencias Físicas, Dpt. Astrofísica, Av. Complutense s/n, 28040 Madrid, Spain
16
Jet Propulsion Laboratory, California Institute of Technology, MS 183-900, 4800 Oak Grove Drive, Pasadena, CA 91109, USA
17 LESIA, Observatoire de Paris, 92195 Meudon France
18
Department of Physics and Astrophysics, Open University, Walton Hall, Milton Keynes MK7 6AA, UK
19
Rutherford Appleton Laboratory, Chilton OX11 0QX, UK
Received: 30 July 2011
Accepted: 19 October 2011
Abstract
We present Herschel PACS 100 and 160 μm observations of the solar-type stars α Men, HD 88230 and HD 210277, which form part of the FGK stars sample of the Herschel open time key programme (OTKP) DUNES (DUst around NEarby Stars). Our observations show small infrared excesses at 160 μm for all three stars. HD 210277 also shows a small excess at 100 μm, while the 100 μm fluxes of α Men and HD 88230 agree with the stellar photospheric predictions. We attribute these infrared excesses to a new class of cold, faint debris discs. Both α Men and HD 88230 are spatially resolved in the PACS 160 μm images, while HD 210277 is point-like at that wavelength. The projected linear sizes of the extended emission lie in the range from ~115 to ≤ 250 AU. The estimated black body temperatures from the 100 and 160 μm fluxes are ≲22 K, and the fractional luminosity of the cold dust is Ldust/L ⋆ ~ 10-6, close to the luminosity of the solar-system’s Kuiper belt. These debris discs are the coldest and faintest discs discovered so far around mature stars, so they cannot be explained easily invoking “classical” debris disc models.
Key words: circumstellar matter / planetary systems / stars: individual:αMen (HIP 29271) / stars: individual: HD 88230 (HIP 49908) / stars: individual: HD 210277 (HIP 109378)
Herschel is an ESA space observatory with science instruments provided by European-led Principal Investigator consortia and with important participation from NASA.
© ESO, 2011
1. Introduction
Debris discs are tenuous structures associated with main sequence stars that are formed by second-generation dust, which itself resulted from the collisions of large solid bodies. This process, which continuously supplies the circumstellar environment with small dust particles, is inferred from the lifetime of the dust grains against destructive collisions, Poynting-Robertson drag and radiation pressure, which are much shorter than the ages of the host stars. These discs are visible in reflected light at optical wavelengths and in thermal radiation at mid-/far-IR and submillimetre wavelengths (Aumann et al. 1984; Backman & Paresce 1993). General disc characteristics are grain black body temperatures of ~ 50 − 100 K, fractional luminosities f > Ldust/L ⋆ ~ 10-5, and radii from less than 10 AU to several times 100 (e.g. Absil et al. 2006; Su et al. 2005; Trilling et al. 2008). Debris discs are considered analogues of the solar system asteroid and Kuiper belts, although their luminosities are usually more than 100 times the Kuiper belt level of Ldust/LSun ~ 10-7 − 10-6 (Stern 1996; Vitense et al. 2010). The sensitivity of the 3.5 m Herschel far-IR space telescope (Pilbratt et al. 2010) with its instrument PACS (Poglitsch et al. 2010) offers the possibility of characterising colder (~30 K) and fainter (Ldust/L ⋆ few times 10-7) debris discs with spatial resolution ~60 AU (FWHM) at 10 pc, i.e., true extra-solar Kuiper belts.
DUNES is a Herschel OTKP designed to detect and characterise extra-solar analogues to the Kuiper belt around main sequence FGK nearby stars (Eiroa et al. 2010). In this letter we present the results for three stars from the DUNES sample (α Men, HD 88230, and HD 210277) as clear examples of the advantages offered by Herschel observations: they trace a new class of cold, T ≲ 22 K, spatially resolved debris discs with very low fractional luminosities. These discs have remained unobserved by previous far-IR and submillimetre studies. Table 1 gives some properties of the stars. Ages are based on the  activity index and have an uncertainty of 60% (Mamajek & Hillenbrand 2008). HD 210277 hosts a Jupiter-like planet (Marcy et al. 1999). This star and α Men have faint stellar companions, but neither the measurements nor the photospheric predictions are affected by them. Eiroa et al. (in prep.) will present a full discussion of the stars and the general results of the DUNES survey.
2. Observations and data reduction
Stellar properties.
Log of the PACS 100 μm and 160 μm observations.
The stars α Men, HD 88230, and HD 210277 were observed with PACS 100/160 μm in scan map mode. For each star, two scans at position angles 70° and 110° were carried out, each scan consisting of ten legs with separation of 4′′, length of 3′, and medium speed of 20′′/s. Table 2 gives the scan identification numbers (Obs. ID) and the total duration of the observations (OT). The star α Men was observed twice in order to increase the signal-to-noise (S/N) ratio. Data reduction was made using the Herschel interactive processing environment (HIPE) version 7.2. The individual scans were mosaicked to produce the final image at each band. To check the consistency of the reduction and analysis (particularly regarding the effect of correlated noise), mosaics were produced at both the native 3 2 for 100 μm (green) and 64 for 160 μm (red), as well as super-sampled pixel scales 1.0′′ (green) and 2.0′′ (red), the latter being the default pixel size in HIPE for this type of data. The images with the native pixel size scales avoid, at least partly, the correlated noise in the PACS images1 (see also Fruchter & Hook 2002). A high-pass filter was used to remove large-scale background emission from the images, with filter widths of 15′′ and 25′′ in the green and red channels. To prevent the removal of any extended structure near the stars, regions where the sky brightness exceeded a threshold value in the image defined by the standard deviation of all the positive pixels (S > 10-6 Jy/pixel) were masked from that process. Absolute flux-calibration uncertainties are ~3% and ~5% for the green and red bands.
3. Results
Table 3 gives the J2000.0 optical equatorial coordinates of the stars, as well as their 100 μm peak positions corrected for the proper motions of the stars (van Leeuwen 2007). Offsets between the optical and the PACS positions (Col. 4 of Table 3) are within the ~ 1.5σ the Herschel pointing accuracy of 24 in this observing mode (Sánchez-Portal, priv. comm.).
Figure 1 shows the 100 and 160 μm images and isocontour plots of the stars. The stars α Men and HD 88230 are point-like at 100 μm,  , while both stars are resolved at 160 μm, with angular sizes/position angles ~18″/52° and ~235/45°, respectively. The extended emission appears clearly asymmetric in HD 88230, with the star located on the NE side. None of the objects are resolved in the direction orthogonal to the extended emission. HD 210277 is unresolved at both wavelengths.
PACS fluxes (Table 3) were estimated using circular and rectangular aperture photometry, taking special care to choose the reference background region due to the presence of field objects. Specifically, measurements of HD 210277 take the presence of the bright object located at ~16″ NE of the star into account; in addition for this star we carried out PSF photometry using the DAOPHOT software package. The PSF photometry fluxes are F(100) = 8.4 ± 0.3 mJy and F(160) = 14.3 ± 0.4 mJy (errors are those of the PSF fits), which are consistent with the aperture photometry estimates. Errors were estimated using a variety of methods, including circular and rectangular boxes at different positions in the nearby fields. Sky sizes for the error estimates are equal to the area of the aperture used for the photometry for all three stars and both bands, in particular, the sizes of the extended emission around α Men and HD 88230.
PACS fluxes were compared to predicted stellar photospheric fluxes (Table 3) using Gaia/PHOENIX models (Brott & Hauschildt 2005), with the stellar parameters as given in Eiroa et al. (in prep.). Figure 1 shows the spectral energy distributions (SEDs) of the stars, where PACS fluxes are plotted together with optical, near-IR, IRAS, AKARI, and Spitzer/MIPS and IRS data; in addition, the best χ-square photospheric fit is shown. To assess the presence of an excess at 100 and/or at 160 μm, we required that the observed fluxes, FPACS, exceed the predicted photospheric fluxes, F∗ (χλ = (FPACS − F∗)/σλ), by at least 3σ. No excesses are detected at 100 μm for α Men and HD 88230, while it is seen in HD 210277. All three stars do show 160 μm excesses. We also note that the SED slopes from 100 to 160 μm are α = − 0.5 ± 0.7 (α Men), α = −0.7 ± 0.6 (HD 88230), and α = 0.8 ± 0.8 (HD 210277), which clearly differ from the expected Rayleigh-Jeans behaviour (α = − 2.0) of a stellar photosphere in this wavelength regime.
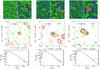 |
Fig. 1 PACS images, isocontours, and SEDs of α Men/HIP 29271 (left), HD 88230/HIP 49908 (middle), and HD 210277/HIP 109378 (right). Images: 100 μm (left), 160 μm (right). North is up and east to the left. Isocontours: 100 μm contours are in green, while the 160 μm ones are in red. α Men: 100 μm contours (10, 20, 40, 80, 90% of the flux peak); 160 μm contours (20, 40, 60, 80, 90% of the flux peak) HD 88230: 100 μm contours (10, 20, 30, 40, 60, 80, 90% of the flux peak); 160 μm contours (20, 30, 40, 50, 60, 80, 90% of the flux peak) HD 210277: 100 μm contours (30, 40, 50, 60, 70, 80, 90% of the flux peak); 160 μm contours (50, 60, 70, 80, 90% of the flux peak). The lowest contour in all cases is ≈ 3σ. The optical position of the stars are indicated by the symbol “*” in the isocontour plots; a segment indicates the projected linear sizes at the distance of each star. SED plots: black line is the photospheric fit while the blue line is the photosphere plus a 22 K black body. |
Equatorial coordinates, observed fluxes with 1σ statistical errors (FPACS), and predicted photospheric fluxes (F ⋆ ). Flux units are mJy.
3.1. Comments on the PACS images
All three fields show ~2−3 red sources per square arcmin, which are likely to be background galaxies. In particular, there is a faint peak at ~13″ towards the SW from HD 88230 and a bright one at ~16″ towards the NE from HD 210277. We have consulted the NASA/IPAC extragalactic database to search for counterparts without finding any association. Although we cannot firmly exclude a coincidental alignment or contamination of a background source(s) in the line of sight of our stars, we think that this is unlikely for the sources presented here owing to the close correlation between the optical and Herschel positions, and to the photospheric predictions and the estimated Herschel 100 μm fluxes. In fact, following the source counts by Berta et al. (2010) in a first approach, the average density of extragalactic sources with fluxes of ~6−7 mJy and ~12 mJy – i.e., the measured excesses at 160 μm from α Men/HD 88230 and HD 210277, respectively (Table 3) – are 2/arcmin2 and 0.7/arcmin2. Thus, given the optical/160 μm offsets (Fig. 1) the a priori probability of an accidental alignment is very low, clearly below 5%. We refer the reader to a future paper (del Burgo et al., in prep.) for a detailed study on source contamination within the DUNES fields.
4. Analysis
The small PACS excesses above the photospheric fluxes are interpreted as being from cold debris discs around the stars. Black body dust temperatures, Tdust, can be estimated from the 100 and 160 μm excess fluxes for HD 210277. In the case of α Men and HD 88230, an upper limit for Tdust can be calculated taking the 100 μm flux as 3σ statistical noise, and Tdust for the three stars is ≲ 22 K (Table 4). The corresponding inner radii of discs with black body grains at this Tdust, considering the luminosity of the stars, are also given in Table 4. Figure 1 shows the excellent agreement between the combined SED of the stellar photospheric fits along with 22 K black bodies and the observed SEDs.
Deconvolution of the images can be used to estimate the true size of the resolved discs in α Men and HD 88230. Our method first removes the photospheric contributions from each image by subtracting a PSF with a peak that is scaled to the predicted photospheric flux level. The PSF model uses α Boötis images, rotated to match the roll angle of the telescope during the observations of the DUNES stars. After star subtraction, the images are deconvolved using both modified Wiener and Richardson-Lucy algorithms. The noise model takes into account that the main contributor is the telescope thermal emission. Both algorithms produce consistent results, although with different noise patterns. Figure 2 shows the 160 μm star-subtracted and the Wiener-deconvolved images of α Men and HD 88230. The estimated sizes of the deconvolved sources are 16″ and 21″, respectively. Table 4 gives the linear sizes of the semi-major axes (~3σ contours) from both the original and deconvolved PACS 160 μm images. For HD 210277, the value in Table 4 corresponds to an upper limit of 12″, i.e., approximately the 160 μm beam size. The comparison of both the directly observed and deconvolved semi-major axes to the estimated radii from Tdust clearly indicates that the observed discs (assuming symmetric discs) are smaller than the expected sizes for black body discs.
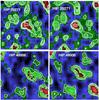 |
Fig. 2 160 μm star-subtracted (left) and deconvolved (right) images. Up: α Men/HIP 29271. Contours: 10%, 20%,40%, 80% of the peak. Bottom: HD 88230/HIP 49908. Contours: 20%,40%, 80% of the peak. North is up and East to the left. Field size is 60″ × 60″. |
The fractional luminosities of the dust, f (Table 4), can be obtained by taking the 160 μm fluxes and assuming the star temperatures given in Table 1 and Tdust = 22 K (Beichman et al. 2006). The estimated f values are of the order of 10-6, hence close to the Kuiper belt level. Essentially, similar f values are obtained by taking the maximum wavelength corresponding to 22 K, i.e., 230 μm, and its expected flux after extrapolating from the one measured at 160 μm.
Black body dust temperatures from the far-IR excesses, Tdust, and the corresponding estimated radii.
5. Discussion
The debris discs in this work are a new class of discs characterised by an excess at 160 μm, little to no excess at 100 μm, and no excess emission at shorter wavelengths. These discs are the coldest and least luminous ones known to date; e.g., they are significantly colder and fainter than other observed DUNES discs (Eiroa et al. 2010; Liseau et al. 2010; Marshall et al. 2011). Their interpretation poses significant challenges.
The shapes of the SEDs suggest that the dust is located in a ring with a larger inner void. We have seen that the observed disc radii are smaller than those implied from Tdust (Table 4). In other words, Tdust is lower than the black body temperature, Tbb ≈ 25−30 K, given the observed sizes and stellar luminosities. Thus, we need to reconcile these seemingly contradictory results. Since one would reasonably expect a broad grain size distribution, which would include hotter small grains than those indicated by the estimated Tdust, the question is how to make the dust cold, while allowing a size distribution, but still keeping the disc radii within the observed ones.
The low temperatures of grains require them to be large and highly reflective. The required albedo can be derived from Tdust and Tbb. Taking Tdust = 22 K as representative for the three observed discs and Tbb = 25 − 30 K, the albedo would be ≳ 50%. For comparison, surfaces of trans-Neptunian objects contain significant amounts of ice (Barucci et al. 2011), and many, especially large ones (e.g. Pluto, Eris), have albedos in excess of 50% (e.g. Vitense et al. 2010). Accordingly, Pluto has a surface brightness temperature ~10 K below the black body value (Gurwell et al. 2010). It is natural to expect that dust released from the surfaces of such objects would have similar properties.
In addition, one has to explain why small grains in the cold discs are depleted. One possibility is to assume a very low dynamical excitation of dust-producing planetesimals, so that discs would be devoid of small particles (Thébault & Wu 2008). The reason is that low collision velocities between large grains, unaffected by radiation pressure, create an imbalance between the rates at which small grains are produced (low) and destroyed (high). Low collision velocities are compatible with low orbital velocities at the large radii of the cold discs. Besides, since the surface density of the solids far from the central stars is also low, planetesimal accretion scenarios predict very long accretion time scales (Kenyon & Bromley 2008). Thus, large planetesimals that would excite the discs may have failed to grow. In fact, low dynamical excitation has been inferred for other large debris discs, e.g. HD 207129 (Löhne et al. 2011).
The tenet that the cold discs are probably in a low dynamical excitation state would be difficult to reconcile with the existence of large planets in the discs, since they would stir the discs too strongly. The emission around α Men and HD 88230 is asymmetric, which might suggest the presence of a giant planet as in Fomalhaut (Kalas et al. 2008). The problem can be mitigated if the planets are in nearly circular orbits or if the planetesimals have low eccentricities, as suggested for Fomalhaut (Chiang et al. 2009). HD 210277 hosts a planet at 1.1 AU with ep = 0.47; however, based on the formulae by Mustill & Wyatt (2009), a stirring front from such a planet should not be able to reach the ~130 AU-sized disc on Gyr time scales.
Another point is the origin of the inner voids in the cold discs. These could either come from clearing by planets or may reflect the accretional and collisional history of primordial discs. In the latter case, the observed radii are those at which solids could reach appropriate sizes, appropriate degree of dynamical excitation, and/or were able to survive over the stellar age, to produce the observed emission. We refer to Krivov et al. (in prep.) where possible scenarios will be discussed in detail.
6. Conclusions
We have presented Herschel PACS observations of three stars in the OTKP DUNES sample. The observations reveal a new class of debris discs with fractional luminosities close to the solar system Kuiper’s belt, but they are colder and larger. These discs are a challenge to current models that explain debris discs around mature solar-type stars such as either the usual collisional-dominated disc scenario or low dynamical excitation discs.
Technical Note PICC-ME-TN-037 in http://herschel.esac.esa.int
References
- Absil, O., di Folco, E., Mérand, A., et al. 2006, A&A, 452, 237 [NASA ADS] [CrossRef] [EDP Sciences] [Google Scholar]
- Aumann, H. H., Beichman, C. A., Gillet, F. C., et al. 1984, ApJ, 278, L23 [NASA ADS] [CrossRef] [Google Scholar]
- Backman, D. E., & Paresce, F. 1993, in Protostars and Planets III, ed. E. H. Levy, & J. I. Lunine (Tucson: Univ. Arizona Press), 1253 [Google Scholar]
- Barucci, M. A., Alvarez-Candal, A., Merlin, F., et al. 2011, Icarus, 214, 297 [NASA ADS] [CrossRef] [Google Scholar]
- Beichman, C. A., Bryden, G., Stapelfeldt, K. R., et al. 2006, ApJ, 652, 1674 [NASA ADS] [CrossRef] [Google Scholar]
- Berta, S., Magnelli, B., Lutz, D., et al. 2010, A&A, 518, L30 [NASA ADS] [CrossRef] [EDP Sciences] [Google Scholar]
- Brott, I., & Hauschildt, P. H. 2005, ESA SP-576, ed. C. Turon, K. S. O’Flaherty, M. A. C. Perryman, 565 [Google Scholar]
- Chiang, E., Kite, E., Kalas, P., Graham, J. R., & Clampin, M. 2009, ApJ, 693, 734 [Google Scholar]
- Eiroa, C., Fedele, D., Maldonado, J., et al. 2010, A&A, 518, L131 [NASA ADS] [CrossRef] [EDP Sciences] [Google Scholar]
- Fruchter, A. S., & Hook, R. R. 2002, PASP, 114, 144 [NASA ADS] [CrossRef] [Google Scholar]
- Gurwell, M. A., Butler, B. J., & Moullet, A. 2010, BAAS, 42, 1014 [NASA ADS] [Google Scholar]
- Kalas, P., Graham, J. R., Chiang, E., et al. 2008, Science, 322, 1345 [NASA ADS] [CrossRef] [PubMed] [Google Scholar]
- Kenyon, S. J., & Bromley, B. C. 2008, ApJS, 179, 451 [NASA ADS] [CrossRef] [Google Scholar]
- Liseau, R., Eiroa, C., Fedele, D., et al. 2010, A&A, 518, L132 [NASA ADS] [CrossRef] [EDP Sciences] [Google Scholar]
- Löhne, T., Augereau, J.-C., Ertelet, S., et al. 2011, A&A, accepted [Google Scholar]
- Mamajek, E. E., & Hillenbrandt, L. A. 2008, ApJ, 687, 1264 [NASA ADS] [CrossRef] [Google Scholar]
- Marcy, G. W., Butler, R. P., Vogt, S. S., Fischer, D., & Liu, M. C. 1999, ApJ, 520, 239 [NASA ADS] [CrossRef] [Google Scholar]
- Mustill, A. J., & Wyatt, M. C. 2009, MNRAS, 399, 1403 [NASA ADS] [CrossRef] [Google Scholar]
- Pilbratt, G., Riedinger, J. R., Passvogel, T., et al. 2010, A&A, 518, L1 [CrossRef] [EDP Sciences] [Google Scholar]
- Poglitsch, A., Waelkens, C., Geis, N., et al. 2010, A&A, 518, L2 [NASA ADS] [CrossRef] [EDP Sciences] [Google Scholar]
- Stern, S. A. 1996, A&A, 310, 999 [NASA ADS] [Google Scholar]
- Su, K. Y. L., Rieke, G. H., Misselt, K. A., et al., 2005, ApJ, 628, 487 [NASA ADS] [CrossRef] [Google Scholar]
- Thébault, P., & Wu, Y. 2008, A&A, 481, 713 [NASA ADS] [CrossRef] [EDP Sciences] [Google Scholar]
- Trilling, D. F., Bryden, G., Beichman, C. A., et al. 2008, ApJ, 674, 1086 [NASA ADS] [CrossRef] [Google Scholar]
- van Leeuwen, F. 2007, A&A, 474, 653 [NASA ADS] [CrossRef] [EDP Sciences] [Google Scholar]
- Vitense, Ch., Krivov, A. V., & Löhne, T. 2010, A&A, 520, A32 [NASA ADS] [CrossRef] [EDP Sciences] [Google Scholar]
All Tables
Equatorial coordinates, observed fluxes with 1σ statistical errors (FPACS), and predicted photospheric fluxes (F ⋆ ). Flux units are mJy.
Black body dust temperatures from the far-IR excesses, Tdust, and the corresponding estimated radii.
All Figures
|
Fig. 1 PACS images, isocontours, and SEDs of α Men/HIP 29271 (left), HD 88230/HIP 49908 (middle), and HD 210277/HIP 109378 (right). Images: 100 μm (left), 160 μm (right). North is up and east to the left. Isocontours: 100 μm contours are in green, while the 160 μm ones are in red. α Men: 100 μm contours (10, 20, 40, 80, 90% of the flux peak); 160 μm contours (20, 40, 60, 80, 90% of the flux peak) HD 88230: 100 μm contours (10, 20, 30, 40, 60, 80, 90% of the flux peak); 160 μm contours (20, 30, 40, 50, 60, 80, 90% of the flux peak) HD 210277: 100 μm contours (30, 40, 50, 60, 70, 80, 90% of the flux peak); 160 μm contours (50, 60, 70, 80, 90% of the flux peak). The lowest contour in all cases is ≈ 3σ. The optical position of the stars are indicated by the symbol “*” in the isocontour plots; a segment indicates the projected linear sizes at the distance of each star. SED plots: black line is the photospheric fit while the blue line is the photosphere plus a 22 K black body. |
| In the text | |
|
Fig. 2 160 μm star-subtracted (left) and deconvolved (right) images. Up: α Men/HIP 29271. Contours: 10%, 20%,40%, 80% of the peak. Bottom: HD 88230/HIP 49908. Contours: 20%,40%, 80% of the peak. North is up and East to the left. Field size is 60″ × 60″. |
| In the text | |
Current usage metrics show cumulative count of Article Views (full-text article views including HTML views, PDF and ePub downloads, according to the available data) and Abstracts Views on Vision4Press platform.
Data correspond to usage on the plateform after 2015. The current usage metrics is available 48-96 hours after online publication and is updated daily on week days.
Initial download of the metrics may take a while.