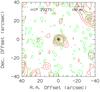
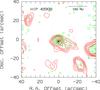
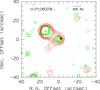
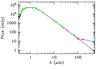
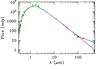
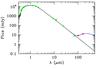
Fig. 1
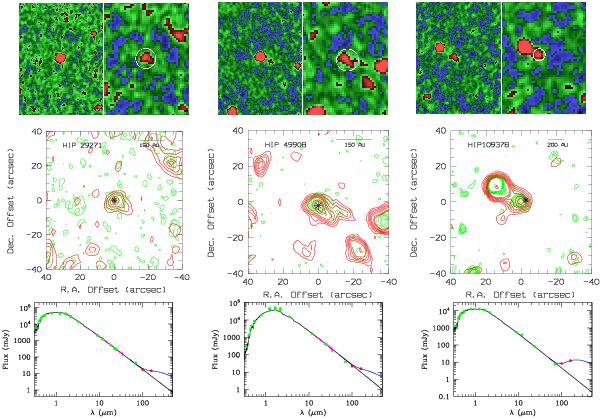
PACS images, isocontours, and SEDs of α Men/HIP 29271 (left), HD 88230/HIP 49908 (middle), and HD 210277/HIP 109378 (right). Images: 100 μm (left), 160 μm (right). North is up and east to the left. Isocontours: 100 μm contours are in green, while the 160 μm ones are in red. α Men: 100 μm contours (10, 20, 40, 80, 90% of the flux peak); 160 μm contours (20, 40, 60, 80, 90% of the flux peak) HD 88230: 100 μm contours (10, 20, 30, 40, 60, 80, 90% of the flux peak); 160 μm contours (20, 30, 40, 50, 60, 80, 90% of the flux peak) HD 210277: 100 μm contours (30, 40, 50, 60, 70, 80, 90% of the flux peak); 160 μm contours (50, 60, 70, 80, 90% of the flux peak). The lowest contour in all cases is ≈ 3σ. The optical position of the stars are indicated by the symbol “*” in the isocontour plots; a segment indicates the projected linear sizes at the distance of each star. SED plots: black line is the photospheric fit while the blue line is the photosphere plus a 22 K black body.
Current usage metrics show cumulative count of Article Views (full-text article views including HTML views, PDF and ePub downloads, according to the available data) and Abstracts Views on Vision4Press platform.
Data correspond to usage on the plateform after 2015. The current usage metrics is available 48-96 hours after online publication and is updated daily on week days.
Initial download of the metrics may take a while.