Fig. 8
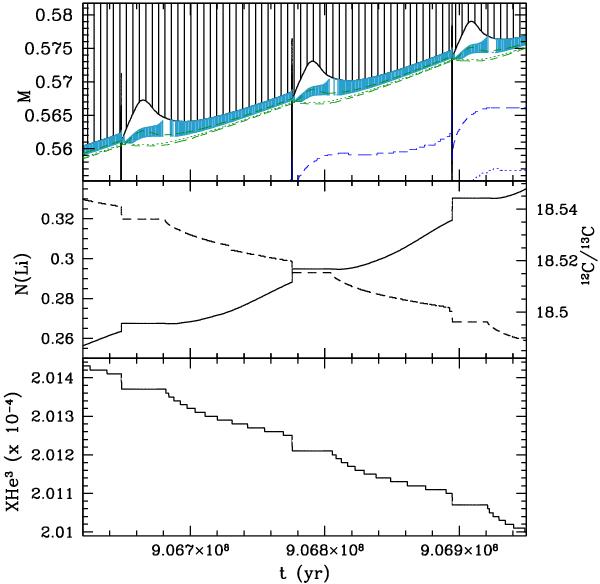
Zoom on the effect of thermohaline mixing between the thermal pulses number 7 and 9 for the 2.5 M⊙ rotating model at Z⊙. (Bottom) Kippenhahn diagram. The hatched zone is the convective envelope; the blue shaded region corresponds to the layers where the thermohaline instability develops; the green and blue dashed lines surround the hydrogen and the helium burning shell respectively (in both cases, the dotted lines show the region of maximum nuclear energy production). (Middle) Evolution of the surface 7Li abundance (full line) and 12C/13C ratio (dashed line). (Bottom) Evolution of the surface 3He abundance (in mass fraction).
Current usage metrics show cumulative count of Article Views (full-text article views including HTML views, PDF and ePub downloads, according to the available data) and Abstracts Views on Vision4Press platform.
Data correspond to usage on the plateform after 2015. The current usage metrics is available 48-96 hours after online publication and is updated daily on week days.
Initial download of the metrics may take a while.