Fig. 5
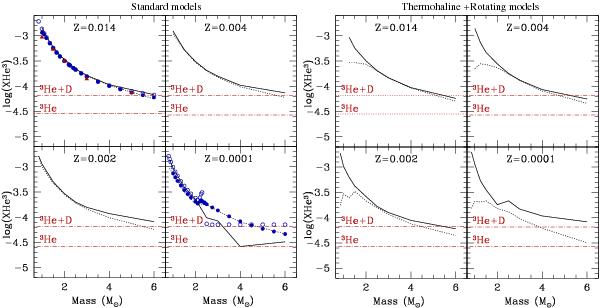
Surface abundance of 3He (in mass fraction) at the end of first and second dredge-up episodes (solid and dashed black lines respectively) as a function of initial stellar mass and for the four metallicities considered (for the 3 to 6 M⊙ standard models at Z = 0.0001 that do not undergo first dredge-up, we show instead the 3He surface abundance at the main-sequence turnoff). Red dotted curves indicate the initial 3He abundance and total D + 3He assumed at stellar birth. (Left) Standard models. Full red triangles correspond to the predictions by Weiss et al. (1996) at the end of 1DUP for Z⊙; blue circles (open and full at the end of 1DUP and 2DUP respectively) are predictions by Sackmann & Boothroyd (1999) for Z⊙ and Z = 10-4. (Right) Models including thermohaline and rotation-induced mixings.
Current usage metrics show cumulative count of Article Views (full-text article views including HTML views, PDF and ePub downloads, according to the available data) and Abstracts Views on Vision4Press platform.
Data correspond to usage on the plateform after 2015. The current usage metrics is available 48-96 hours after online publication and is updated daily on week days.
Initial download of the metrics may take a while.