Fig. 7
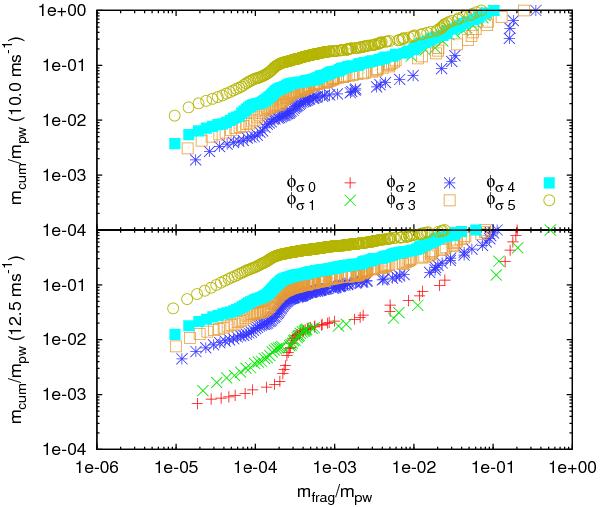
Cumulative mass distribution of a power-law population for different inhomogeneity parameters φσ and collision velocities v0 = 10 m s-1 (top) v0 = 12.5 m s-1 (bottom). In both velocity cases both the mass of the largest member of the power-law population and the power-law slope decrease. This indicates the fragmentation to smaller aggregates for increasing φσ. For equal φσ, the slopes are shallower for the higher velocity. The power-law fit parameters can be found in Table 3.
Current usage metrics show cumulative count of Article Views (full-text article views including HTML views, PDF and ePub downloads, according to the available data) and Abstracts Views on Vision4Press platform.
Data correspond to usage on the plateform after 2015. The current usage metrics is available 48-96 hours after online publication and is updated daily on week days.
Initial download of the metrics may take a while.