Fig. B.1
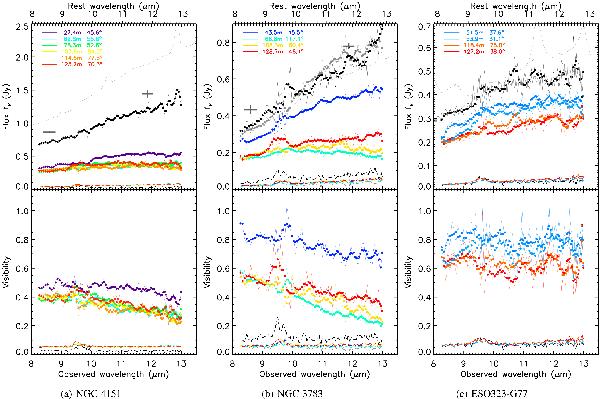
All the mid-IR data shown in Figs. 1 and 2 and summarized in Table 5 are plotted here in more conventional ways for a) NGC 4151, b) NGC 3783, and c) ESO323-G77. Top: the total flux and correlated flux spectra taken with MIDI are shown in units of Jy. The filled circles indicate the spectra with a 5-pixel boxcar smoothing (3 pixel for NGC 4151), while the spectra before the smoothing are shown with thin lines. The total flux is shown in black, while the correlated flux is shown in different colors for different baselines as indicated by the legend at top-left where the projected baseline lengths and PAs are written. The error spectra estimated for the smoothed spectra are shown at the bottom with dash-dot lines using the same corresponding colors. The two fluxes from the broad-band VISIR imaging are shown with error bars in thick gray lines. The thin gray spectra mostly at the highest flux levels are from the Spitzer IRS observations. The slightly darker gray spectrum shown for ESO323-G77 is from the VISIR spectroscopy. For NGC 3783, the total flux taken in 2005 scaled to match the flux in 2009 (see Sect. 2.1) is shown in gray color. Bottom: the resulting visibility spectra are shown using the same color scheme, with the error spectra excluding the total flux error contribution. The fractional total flux errors are drawn separately in black dash-dot lines.
Current usage metrics show cumulative count of Article Views (full-text article views including HTML views, PDF and ePub downloads, according to the available data) and Abstracts Views on Vision4Press platform.
Data correspond to usage on the plateform after 2015. The current usage metrics is available 48-96 hours after online publication and is updated daily on week days.
Initial download of the metrics may take a while.