Fig. A.1
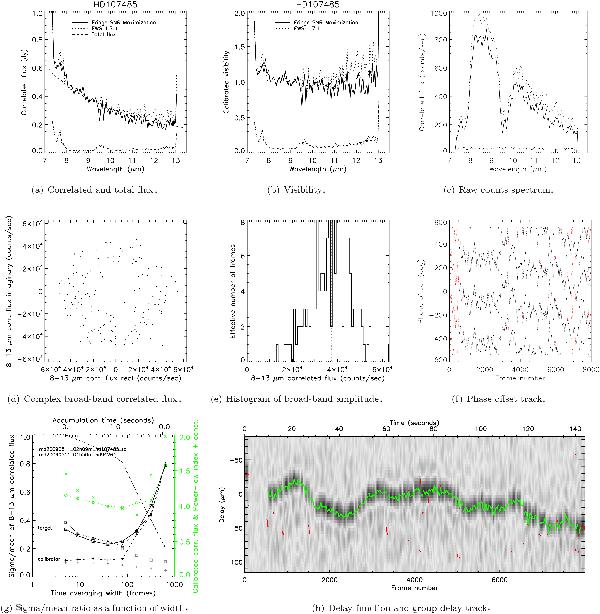
The results for the unresolved star HD107485 taken on 2009-05-11. a) Our results for the calibrated correlated flux and its error are shown in solid and dot-dash line, respectively, while the correlated flux from a default reduction with EWS 1.7.1 (see text) is shown in dotted line. The dashed line is the total flux for this star which is obtained by scaling a template spectrum based on the known spectral type and IRAS flux. b) The same as a) but deduced visibilities are shown instead of correlated flux. c) The same as a but raw counts spectra are shown. d) Broad-band correlated flux measurements integrated over 7−13 μm (smoothed over a particular time width w) are shown on the complex plane. e) Histogram of the amplitude of the broad-band correlated flux from the panel d is shown. f) The phase of the correlated flux as a function of frame number, i.e. time. The same track is repeatedly shown with 360° offsets to clearly indicate the track as a function of time. The red points show excluded frames. g) The ratio of the standard deviation σ to mean m of the correlated flux amplitude measurements is shown as a function of smoothing width w in frames (lower axis) and in seconds (upper axis). The solid line with squares is for the target (HD107485) while the dashed line with plus signs is for the calibrator (see Table A.1). The gray squares and gray plus signs (without any connecting lines) indicate the photon noise (see Sect. A.3) estimated for the target and calibrator, respectively. The dotted line with triangles shows the expected fractional dispersion σ/m curve for the target, which is estimated from the σ/m curve for the calibrator (i.e. the dahed line with plus signs) and the photon noise estimations (i.e. gray squares and plus signs with no connecting lines). The dash-dotted line indicates the relative correlated flux counts of the calibrator as a function of w, showing the relative effective system visibility at each w. The green circles show the relative calibrated broad-band correlated flux as a function of w. The green crosses show the relative power-law index of the calibrated correlated flux spectrum also as a function of w. h) The delay function on the plane of delay versus frame number is drawn in gray scale image, showing the group delay track before the iteration described in Sect. A.5. The green and red points indicate non-rejected and rejected fringe peaks, respectively, after the iteration.
Current usage metrics show cumulative count of Article Views (full-text article views including HTML views, PDF and ePub downloads, according to the available data) and Abstracts Views on Vision4Press platform.
Data correspond to usage on the plateform after 2015. The current usage metrics is available 48-96 hours after online publication and is updated daily on week days.
Initial download of the metrics may take a while.