Fig. 1
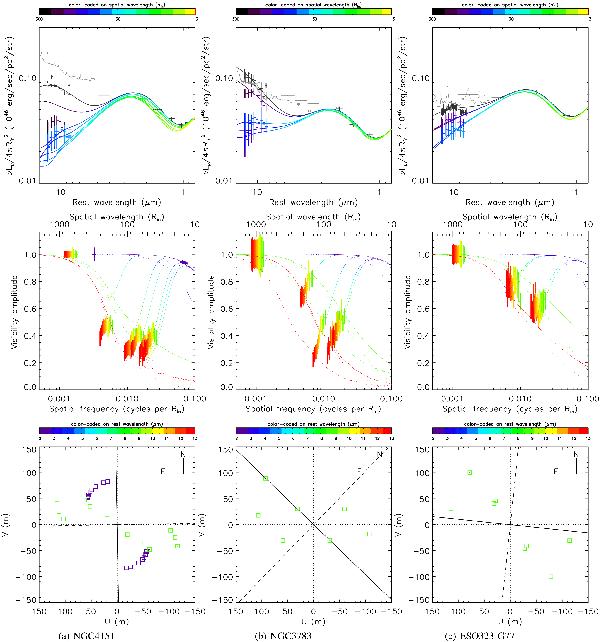
The observed data for a) NGC 4151, b) NGC 3783, and
c) ESO323-G77 (see Sect. 2), and
the best fits using a temperature/density gradient model plus an inner 1400 K ring
(see Sect. 4.4 and Table 8). Top: spectral energy
distribution in  . The data plotted in black are the
total flux measurements from MIDI and VISIR in the mid-IR and from WFCAM or 2MASS in
the near-IR. Additional total flux spectra and photometry from Spitzer
(Table 4) are plotted in gray. For
NGC 3783, ISAAC photometry data (Table 4) are
shown as gray squares. Correlated fluxes from the mid-IR and near-IR interferometry
are plotted with colors coded on spatial wavelengths in units of
Rin as shown in the top color bar. The model curves
for the total flux and the correlated fluxes at baselines corresponding to each MIDI
observation are drawn in the same color coding. Middle: visibility
amplitude plotted against spatial frequency in units of cycles per
Rin. The color of the data points corresponds to the
observing wavelength in the rest frame of the target. This color-coding is shown as
a color bar between the middle and bottom panels. The iso-wavelength model
visibility curves are shown for 13, 8.5, and 2.2 μm, as well as the
curves for each baseline configuration (which are “orthogonal” to the iso-wavelengh
curves). Dotted curves are the visibilities only for the power-law component, with
the difference from solid curves indicating the effect of the near-IR ring. For
NGC 3783, solid and dashed model curves are for equatorial and polar axis PAs,
respectively (see Sect. 4.3).
Bottom: the uv coverage of the mid-IR and
near-IR interferometry with the same color-coding on observing wavelengths. Solid
and dashed lines indicate the PA of the projected equatorial and polar axes,
respectively, inferred from optical polarization and radio data (see Table 5).
. The data plotted in black are the
total flux measurements from MIDI and VISIR in the mid-IR and from WFCAM or 2MASS in
the near-IR. Additional total flux spectra and photometry from Spitzer
(Table 4) are plotted in gray. For
NGC 3783, ISAAC photometry data (Table 4) are
shown as gray squares. Correlated fluxes from the mid-IR and near-IR interferometry
are plotted with colors coded on spatial wavelengths in units of
Rin as shown in the top color bar. The model curves
for the total flux and the correlated fluxes at baselines corresponding to each MIDI
observation are drawn in the same color coding. Middle: visibility
amplitude plotted against spatial frequency in units of cycles per
Rin. The color of the data points corresponds to the
observing wavelength in the rest frame of the target. This color-coding is shown as
a color bar between the middle and bottom panels. The iso-wavelength model
visibility curves are shown for 13, 8.5, and 2.2 μm, as well as the
curves for each baseline configuration (which are “orthogonal” to the iso-wavelengh
curves). Dotted curves are the visibilities only for the power-law component, with
the difference from solid curves indicating the effect of the near-IR ring. For
NGC 3783, solid and dashed model curves are for equatorial and polar axis PAs,
respectively (see Sect. 4.3).
Bottom: the uv coverage of the mid-IR and
near-IR interferometry with the same color-coding on observing wavelengths. Solid
and dashed lines indicate the PA of the projected equatorial and polar axes,
respectively, inferred from optical polarization and radio data (see Table 5).
Current usage metrics show cumulative count of Article Views (full-text article views including HTML views, PDF and ePub downloads, according to the available data) and Abstracts Views on Vision4Press platform.
Data correspond to usage on the plateform after 2015. The current usage metrics is available 48-96 hours after online publication and is updated daily on week days.
Initial download of the metrics may take a while.