Free Access
Fig. 7
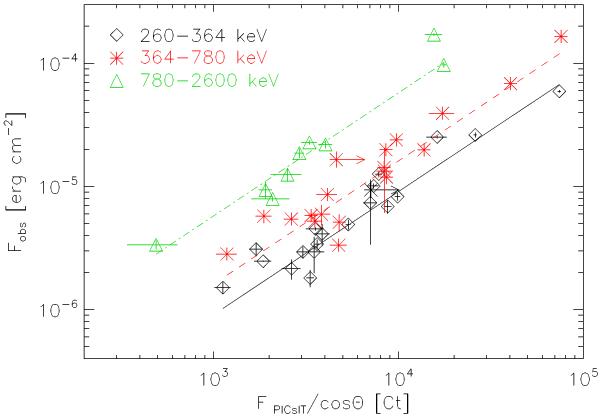
Correlation between PICsIT measured fluence and observed fluence from other instruments for 20 GRBs in our sample in three energy bands. Lines give the expected fluences derived from the conversion parameters in Table 4.
Current usage metrics show cumulative count of Article Views (full-text article views including HTML views, PDF and ePub downloads, according to the available data) and Abstracts Views on Vision4Press platform.
Data correspond to usage on the plateform after 2015. The current usage metrics is available 48-96 hours after online publication and is updated daily on week days.
Initial download of the metrics may take a while.