Fig. 5
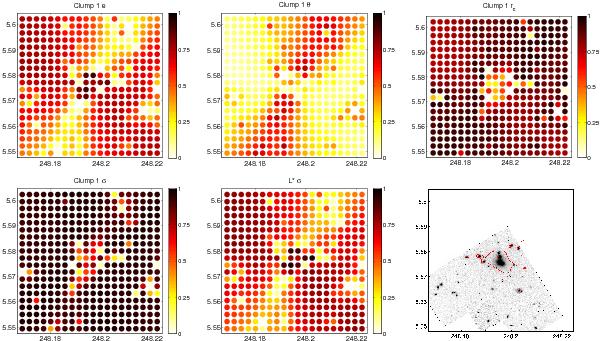
Correlations between the predicted magnification of an image as a function of image position for a source at redshift z = 1 and the different input parameters which are optimized in the model for A2204 (compare Table 2 and Fig. 3) in a field of view ± 100 arcsec around the cluster center. Correlations are given as the absolute values of the correlation coefficients. The last panel shows an ACS image of the cluster overlaid with the critical lines for z = 1.
Current usage metrics show cumulative count of Article Views (full-text article views including HTML views, PDF and ePub downloads, according to the available data) and Abstracts Views on Vision4Press platform.
Data correspond to usage on the plateform after 2015. The current usage metrics is available 48-96 hours after online publication and is updated daily on week days.
Initial download of the metrics may take a while.