Fig. 3
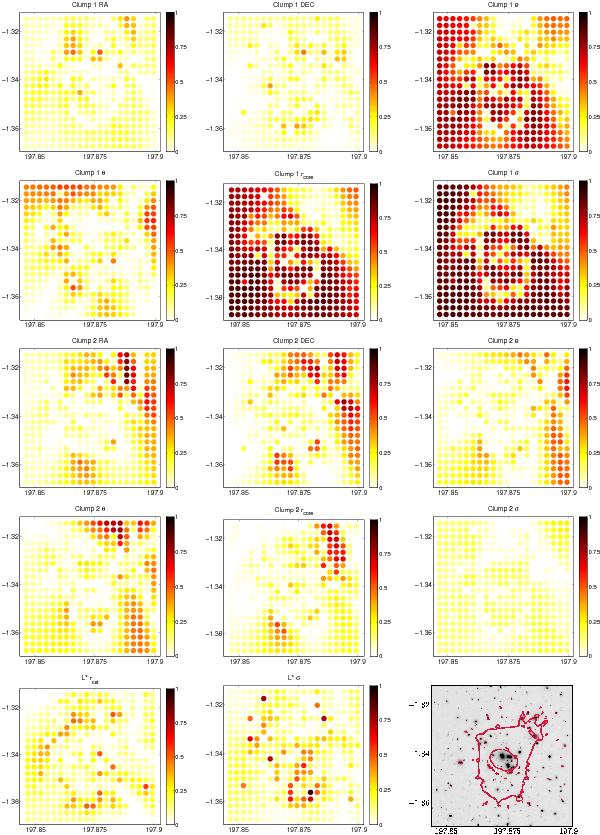
Correlations between the predicted magnification as a function of image position for a source at redshift z = 2 and the input parameters that were optimized in the model for A1689 (compare Table 1) in a field of view ± 100 arcsec around the cluster center. Correlations are given as the absolute values of the correlation coefficients. A high value (close to 1; dark red) indicates that that the magnification for an image at a given position will display large variations when the input parameter is varied. Being able to measure the absolute magification at this image position, using e.g. SNe Ia observations, will thus make it possible to improve the constraints on the cluster parameter. If the correlation is low (close to 0; light yellow), we do not expect magnification information to significantly improve the current constraint on the cluster parameter at hand. The strongest correlations and best possibility of improving the model once a SN Ia is observed, are the ellipticity, e, core radius, rcore, and velocity dispersion, σ, of the main lensing potential. The last panel shows an ACS image of the cluster overlaid with the critical lines for z = 2. The FOV in all panels is identical to that of Fig. 1.
Current usage metrics show cumulative count of Article Views (full-text article views including HTML views, PDF and ePub downloads, according to the available data) and Abstracts Views on Vision4Press platform.
Data correspond to usage on the plateform after 2015. The current usage metrics is available 48-96 hours after online publication and is updated daily on week days.
Initial download of the metrics may take a while.