Fig. 2
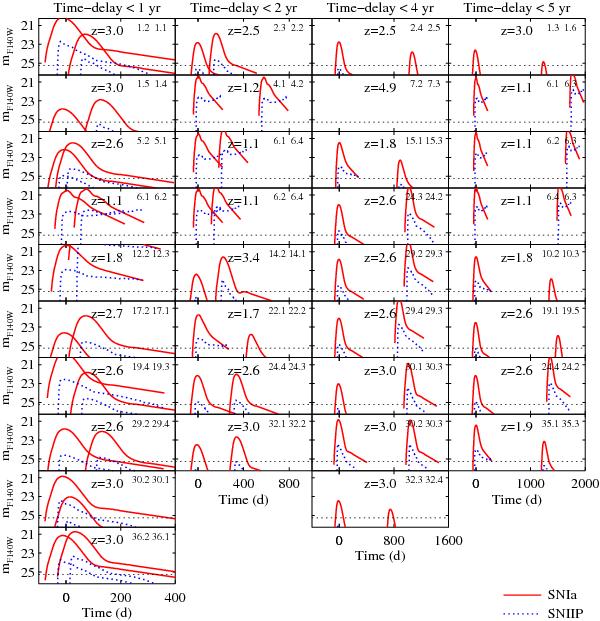
Simulated light curves of SNe Ia and IIP for pairs of images of strongly lensed galaxies behind A1689. Only pairs with time delays shorter than five years are shown. Additional information on different image pairs labeled by, e.g., 1.2 and 1.1 in the top right corner of each sub panel, can be found in Table 3. The dashed line indicates an expected magnitude limit 25.25 (Vega) in F140W.
Current usage metrics show cumulative count of Article Views (full-text article views including HTML views, PDF and ePub downloads, according to the available data) and Abstracts Views on Vision4Press platform.
Data correspond to usage on the plateform after 2015. The current usage metrics is available 48-96 hours after online publication and is updated daily on week days.
Initial download of the metrics may take a while.