Fig. 8
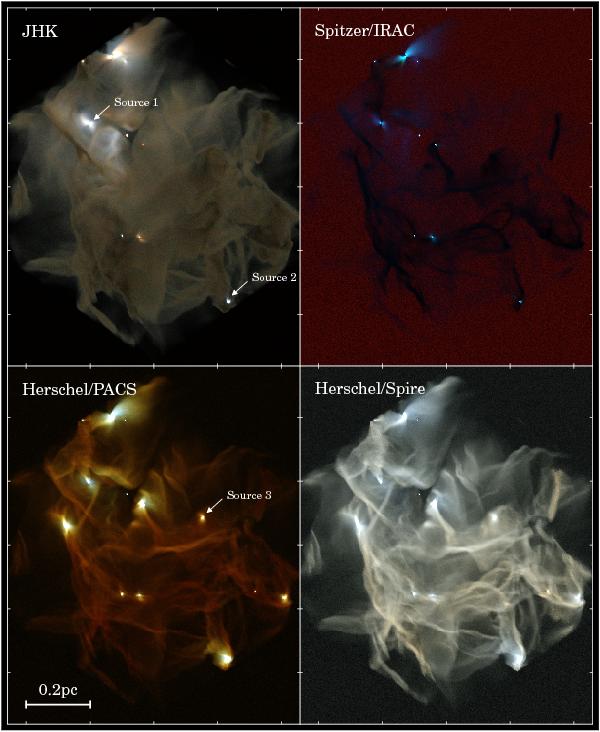
Three-color unconvolved synthetic images of the simulation, from the near-infrared
(top left) and mid-infrared (top right) to the
far-infrared (bottom left and right). The wavelengths and colors used
are 1.25 μm (blue), 1.65 μm (green), and
2.15 μm (red) for the JHK image,
3.6 μm (blue), 4.5 μm (green), and
8.0 μm (red) for the Spitzer/IRAC image,
70 μm (blue), 110 μm (green), and
170 μm (red) for the Herschel/PACS image, and
250 μm (blue), 350 μm (green), and
500 μm (red) for the Herschel/SPIRE image. All
images are shown on an arcsinh stretch which allows a larger dynamic range to be shown
by reducing the intensity of the brightest regions. The exact transformation is given
by  where v is the original flux, m = 30 is a parameter
controlling the compression of the dynamic range, and vmax
is 6, 4, and 2 MJy/sr for J, H, and
K; 2, 2, and 4 MJy/sr for 3.6 μm,
4.5 μm, and 8.0 μm; 3000 MJy/sr for the three PACS
bands; and 1000, 500, and 250 MJy/sr for SPIRE 250 μm,
350 μm, and 500 μm respectively.
where v is the original flux, m = 30 is a parameter
controlling the compression of the dynamic range, and vmax
is 6, 4, and 2 MJy/sr for J, H, and
K; 2, 2, and 4 MJy/sr for 3.6 μm,
4.5 μm, and 8.0 μm; 3000 MJy/sr for the three PACS
bands; and 1000, 500, and 250 MJy/sr for SPIRE 250 μm,
350 μm, and 500 μm respectively.
Current usage metrics show cumulative count of Article Views (full-text article views including HTML views, PDF and ePub downloads, according to the available data) and Abstracts Views on Vision4Press platform.
Data correspond to usage on the plateform after 2015. The current usage metrics is available 48-96 hours after online publication and is updated daily on week days.
Initial download of the metrics may take a while.