Fig. 6
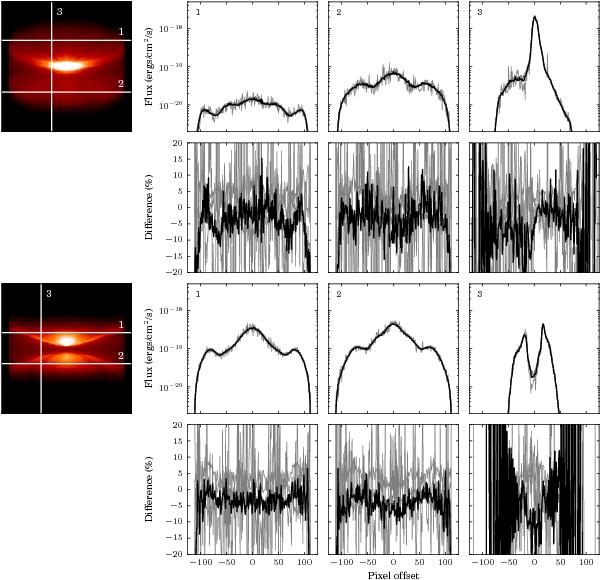
Image results for the Pinte et al. (2009) disk benchmark. The top two rows show the results for the i = 69.5° model, while the bottom two rows show the results for the i = 87.1° model. For each viewing angle, the resulting image is shown on the left on a power-law stretch (with power 1/4), while the remaining plots show various cuts (indicated on the images), in absolute flux units, as well as relative to the reference result in Pinte et al. (2009), which is the average of the MCFOST, MCMAX, TORUS, and Pinball codes. The black lines show the results from Hyperion, while the gray lines show the results from MCFOST, MCMAX, TORUS, and Pinball. As in Pinte et al. (2009), the cuts are 11 pixels wide to improve the signal-to-noise of the profiles.
Current usage metrics show cumulative count of Article Views (full-text article views including HTML views, PDF and ePub downloads, according to the available data) and Abstracts Views on Vision4Press platform.
Data correspond to usage on the plateform after 2015. The current usage metrics is available 48-96 hours after online publication and is updated daily on week days.
Initial download of the metrics may take a while.