Fig. 5
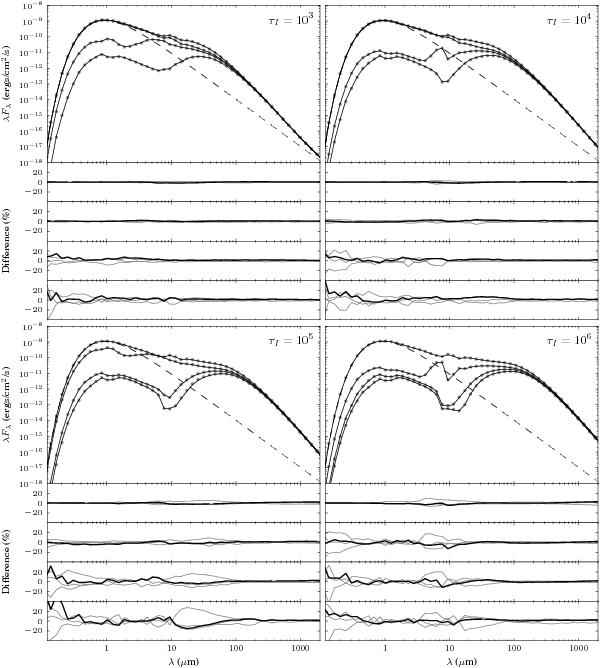
SED results for the Pinte et al. (2009) disk benchmark, for the four disk masses used. In each panel, the top section shows the SED obtained using Hyperion (black line), compared to the average result of the codes used in Pinte et al. (2009) (gray circles), for four of the viewing angles (18.2, 75.5, 81.4, 87.1°). The dashed line shows the blackbody spectrum of the central source. The bottom four sections in each panel show the fractional difference between Hyperion and the reference result (black line), and between the other codes compared in Pinte et al. (2009) and the reference result (gray lines).
Current usage metrics show cumulative count of Article Views (full-text article views including HTML views, PDF and ePub downloads, according to the available data) and Abstracts Views on Vision4Press platform.
Data correspond to usage on the plateform after 2015. The current usage metrics is available 48-96 hours after online publication and is updated daily on week days.
Initial download of the metrics may take a while.