Fig. 4
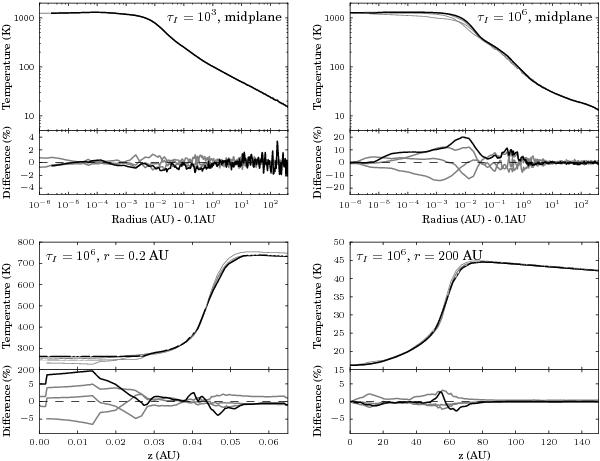
Temperature results for the Pinte et al. (2009) disk benchmark. The top-left and top-right panels shows the radial temperature profile at the disk mid-plane for the lowest and highest disk mass models. The bottom panels shows two vertical cuts through the disk for the highest disk mass model, at cylindrical radii of 0.2 and 200 AU respectively. In each panel, the top section shows the temperature profile in absolute terms, while the bottom section shows the results relative to the reference result from Pinte et al. (2009), which is the average of the results from MCFOST, MCMAX, and TORUS. The black lines show the results from Hyperion, while the gray lines show the results from MCFOST, MCMAX, and TORUS.
Current usage metrics show cumulative count of Article Views (full-text article views including HTML views, PDF and ePub downloads, according to the available data) and Abstracts Views on Vision4Press platform.
Data correspond to usage on the plateform after 2015. The current usage metrics is available 48-96 hours after online publication and is updated daily on week days.
Initial download of the metrics may take a while.