Fig. 10
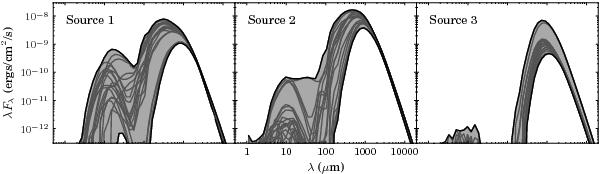
Spectral Energy Distributions for the three sources labelled in Fig. 8. Each panel shows SEDs for 20 different viewing angles. The black lines show the minimum and maximum values as a function of wavelength, the light gray shows the range of values, and the dark gray shows the individual SEDs.
Current usage metrics show cumulative count of Article Views (full-text article views including HTML views, PDF and ePub downloads, according to the available data) and Abstracts Views on Vision4Press platform.
Data correspond to usage on the plateform after 2015. The current usage metrics is available 48-96 hours after online publication and is updated daily on week days.
Initial download of the metrics may take a while.