Fig. 1
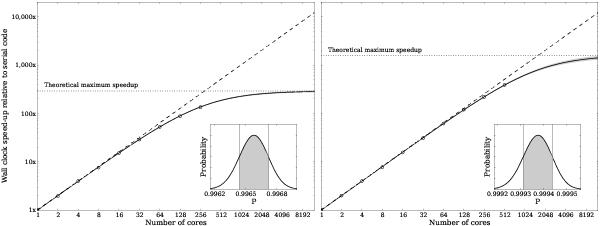
The main panels show the wall clock speedup relative to serial execution for a model of a protoplanetary disk. The right panel shows the same model as that in the left panel, but with 10 times more photon packets for every iteration. The open circles show the average values of 10 executions of the code, and the uncertainties in these values derived from the scatter are not shown as they are smaller than the data points. The dashed curves show the speedup expected from a perfectly parallelized code. The solid curves show the best fit to the speedup curve assuming Amdahl’s law (described in text). The gray shaded areas around the curves show the 68.3% confidence interval. The maximum speedups derived from the best fits are shown as horizontal dotted lines. The inset panels show the probability of different P values, with the 68.3% confidence intervals shown in shaded gray.
Current usage metrics show cumulative count of Article Views (full-text article views including HTML views, PDF and ePub downloads, according to the available data) and Abstracts Views on Vision4Press platform.
Data correspond to usage on the plateform after 2015. The current usage metrics is available 48-96 hours after online publication and is updated daily on week days.
Initial download of the metrics may take a while.