Fig. 5
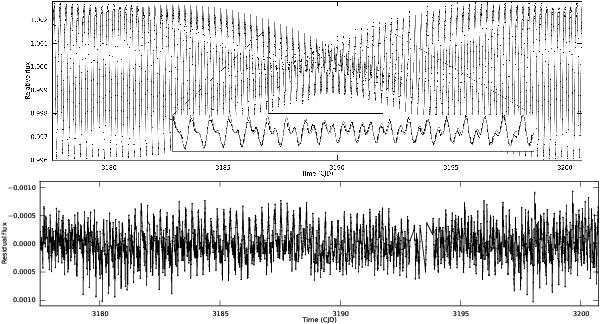
Spot model fit and residuals. Top panel: black dots and lines show the observed CoRoT light curve, corrected for discontinuities. In grey, the best fitting spot model with parameters listed in Table 4 is shown. The inset is a zoom on the middle part of the light curve. Bottom panel: residuals after subtracting the spot model.
Current usage metrics show cumulative count of Article Views (full-text article views including HTML views, PDF and ePub downloads, according to the available data) and Abstracts Views on Vision4Press platform.
Data correspond to usage on the plateform after 2015. The current usage metrics is available 48-96 hours after online publication and is updated daily on week days.
Initial download of the metrics may take a while.