| Issue |
A&A
Volume 536, December 2011
|
|
|---|---|---|
| Article Number | A82 | |
| Number of page(s) | 15 | |
| Section | Stellar structure and evolution | |
| DOI | https://doi.org/10.1051/0004-6361/201116802 | |
| Published online | 13 December 2011 | |
Online material
Appendix A: Light curves and frequency spectra of B8/B9 stars observed with CoRoT
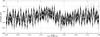 |
Fig. A.1
Excerpt of the CoRoT light curve of HD 181440, showing multiperiodic variability (grey line shows a fit to the light curve, black dots represent to CoRoT data). |
| Open with DEXTER | |
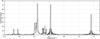 |
Fig. A.2
Frequency spectrum of the CoRoT light curve of HD 181440 above 0.1 d-1 (black). The significant frequencies and fitted amplitudes above 10 ppm are indicated in grey. |
| Open with DEXTER | |
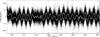 |
Fig. A.3
Excerpt of the CoRoT light curve of HD 182198, with only one clear clear frequency (grey line shows a fit to the light curve, black dots represent to CoRoT data). |
| Open with DEXTER | |
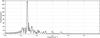 |
Fig. A.4
Frequency spectrum of the CoRoT light curve of HD 182198 above 0.1 d-1 (black). The significant frequencies and fitted amplitudes above 10 ppm are indicated in grey. |
| Open with DEXTER | |
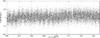 |
Fig. A.5
Excerpt of the CoRoT light curve of HD 49677, with only one clear frequency detected (grey line shows a fit to the light curve, black dots represent to CoRoT data). |
| Open with DEXTER | |
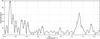 |
Fig. A.6
Frequency spectrum of the CoRoT light curve of HD 49677 above 0.1 d-1 (black). The significant frequencies with amplitudes above 10 ppm are indicated in grey. |
| Open with DEXTER | |
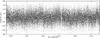 |
Fig. A.7
Excerpt of the CoRoT light curve of HD 46179. No clear signs of variability are detected (grey line shows a fit to the light curve, black dots represent to CoRoT data). |
| Open with DEXTER | |
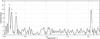 |
Fig. A.8
Frequency spectrum of the CoRoT light curve of HD 46179 above 0.1 d-1 (black). The significant frequencies with amplitudes above 10 ppm are indicated in grey. |
| Open with DEXTER | |
© ESO, 2011
Current usage metrics show cumulative count of Article Views (full-text article views including HTML views, PDF and ePub downloads, according to the available data) and Abstracts Views on Vision4Press platform.
Data correspond to usage on the plateform after 2015. The current usage metrics is available 48-96 hours after online publication and is updated daily on week days.
Initial download of the metrics may take a while.