Fig. 3
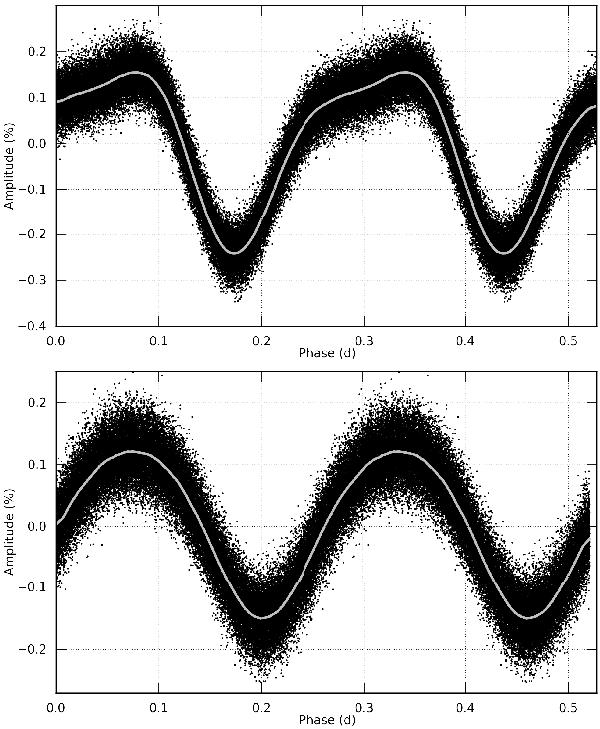
Diagrams of the CoRoT light curve of HD 174648, folded on the dominant frequencies f1 (top) and f2 (bottom), after prewhitening all other detected frequencies. The top phase diagram clearly illustrates the non-sinusoidal shape of the variations for f1; the nonsinusoidal shape for f2 in the bottom diagram is less obvious, but is clearly demonstrated by the presence of the first harmonic of this frequency at 2f2, labelled f4 in Table 3.
Current usage metrics show cumulative count of Article Views (full-text article views including HTML views, PDF and ePub downloads, according to the available data) and Abstracts Views on Vision4Press platform.
Data correspond to usage on the plateform after 2015. The current usage metrics is available 48-96 hours after online publication and is updated daily on week days.
Initial download of the metrics may take a while.