Fig. 9
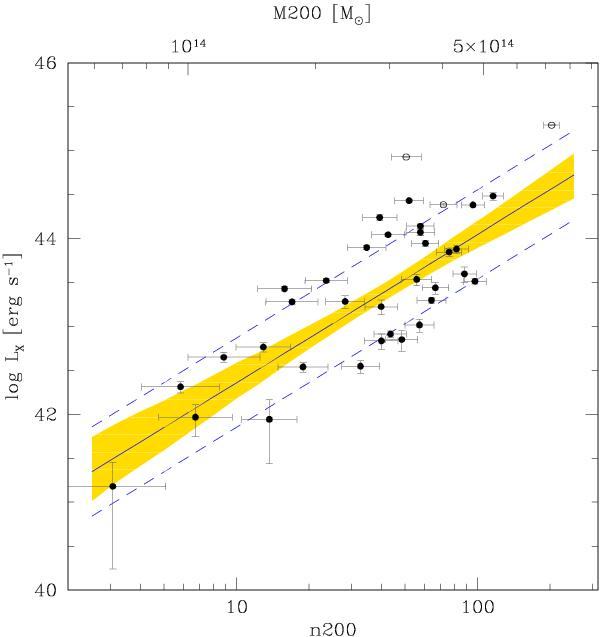
X-ray luminosity-richness scaling. The solid line indicates the mean fitted regression line of log LX, measured within a 500 kpc aperture, on log n200, while the dashed line shows this mean plus or minus the intrinsic scatter σscat. The shaded region marks the 68% highest posterior credible interval for the regression. Error bars on the data points represent observed errors for both variables (computed following the usual astronomical practice). The distances between the data and the regression line is partly caused by the measurement error and partly by the intrinsic scatter. The upper abscissa indicates the cluster mass.
Current usage metrics show cumulative count of Article Views (full-text article views including HTML views, PDF and ePub downloads, according to the available data) and Abstracts Views on Vision4Press platform.
Data correspond to usage on the plateform after 2015. The current usage metrics is available 48-96 hours after online publication and is updated daily on week days.
Initial download of the metrics may take a while.