Fig. 4
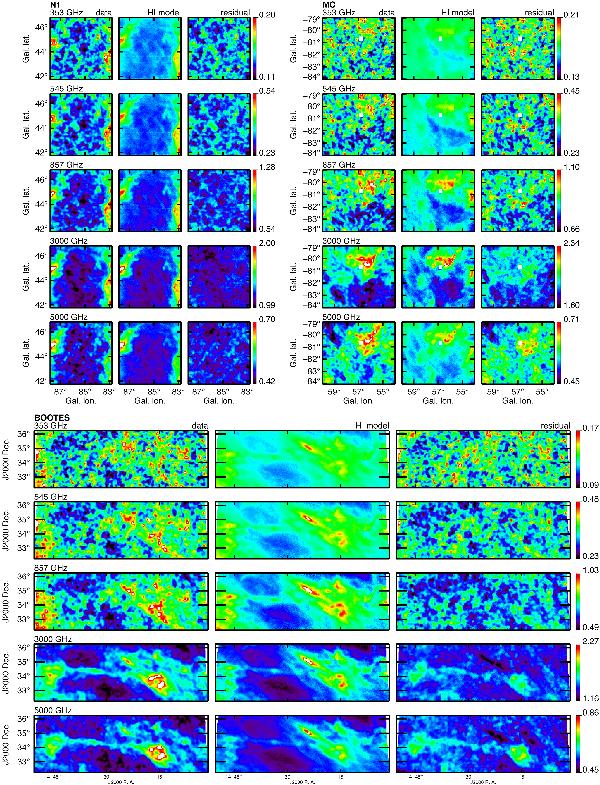
Dust/gas correlation in N1 (top-left), MC (top-right) and BOOTES (bottom): Planck and IRAS raw maps (left column), the model of the dust emission based on the Hi observations (middle: Hi model,  , Eq. (2)) and the residual emission (right, see Eq. (6)). Units are MJysr-1. Data are described in Sect. 3 and model and residual in Sect. 4.
Current usage metrics show cumulative count of Article Views (full-text article views including HTML views, PDF and ePub downloads, according to the available data) and Abstracts Views on Vision4Press platform.
Data correspond to usage on the plateform after 2015. The current usage metrics is available 48-96 hours after online publication and is updated daily on week days.
Initial download of the metrics may take a while.