Fig. 22
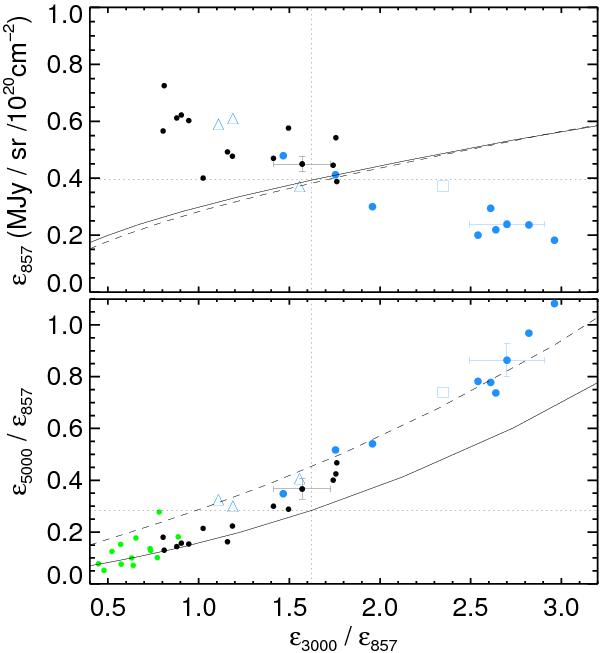
Top: dust emission per NHI at 857GHz versus the 3000/857 GHz (100/350μm) ratio. Local (black), IVC (blue – dot is IV Arch, triangle IV/LLIV Arch, square Complex K), residual (green). Solid line is the DustEM model for the diffuse ISM (Compiègne et al. 2011), with radiation field variations from G = 0.1 to G = 5. Dashed line is the same model but with a relative abundance of VSGs four times higher than the standard diffuse ISM value. Dotted lines gives the local ISM fiducial values (G = 1.0). Typical uncertainties are shown for each Hi component. Bottom: 5000/857 GHz (60/350μm) ratio as a function of the 3000/857 GHz (100/350μm) ratio.
Current usage metrics show cumulative count of Article Views (full-text article views including HTML views, PDF and ePub downloads, according to the available data) and Abstracts Views on Vision4Press platform.
Data correspond to usage on the plateform after 2015. The current usage metrics is available 48-96 hours after online publication and is updated daily on week days.
Initial download of the metrics may take a while.