Fig. 20
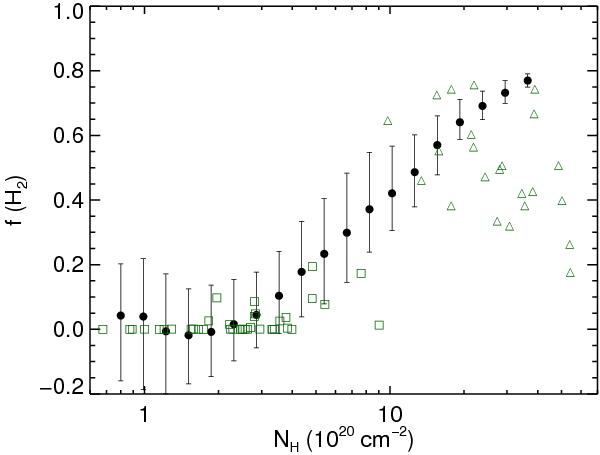
Fraction f(H2) of hydrogen that is in molecular form in local gas/LVC, calculated from emission excess relative to the linear correlation (see text), versus the total column density estimated using the 857GHz dust emission transformed into gas column density using the emissivities ϵν. Black points show the median value of f(H2) in bins of NH computed using all lines of sight in our sample. The error bars show the half-width at half maximum of the PDF computed in each NH bin. Green symbols show the results obtained using UV absorption data from high-latitude surveys (Gillmon et al. 2006; Wakker 2006, squares) and toward O stars on lines of sight closer to the Galactic Plane (Rachford et al. 2002, 2009, triangles).
Current usage metrics show cumulative count of Article Views (full-text article views including HTML views, PDF and ePub downloads, according to the available data) and Abstracts Views on Vision4Press platform.
Data correspond to usage on the plateform after 2015. The current usage metrics is available 48-96 hours after online publication and is updated daily on week days.
Initial download of the metrics may take a while.