Fig. 18
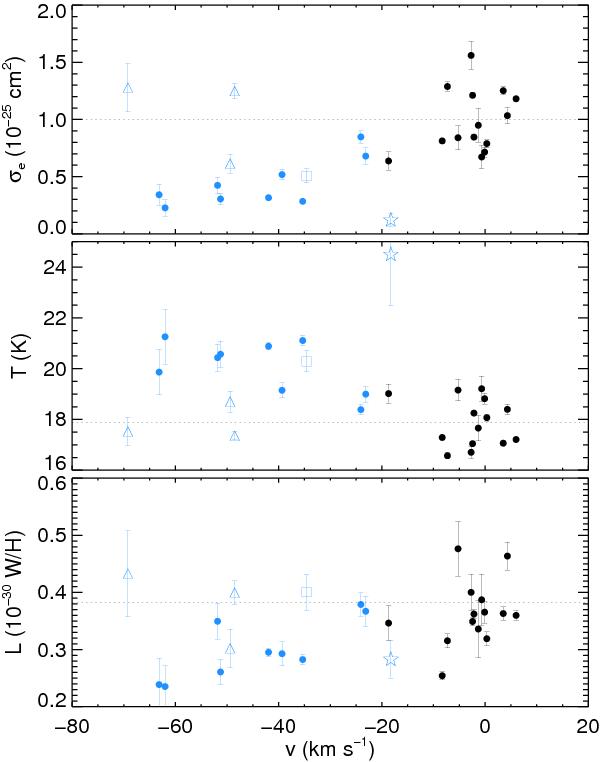
Values of σe at 1200GHz (250μm), T and L versus the average velocity of each Hi component. These dust parameters were estimated from the SED fit over the range 353 to 3000GHz to a modified black body with β = 1.8. Black and blue symbols are for LVC and IVC, respectively. The different symbols in blue represent IVCs associated with specific complexes: IV Arch (dot), IV/LLIV Arch (triangle), Complex K (square) and PP Arch (star). In each panel the dotted line represent the value for the diffuse ISM obtained with the high-latitude FIRAS spectrum (see Fig. 17). Error bars are given for each data point, some being smaller than the symbol size.
Current usage metrics show cumulative count of Article Views (full-text article views including HTML views, PDF and ePub downloads, according to the available data) and Abstracts Views on Vision4Press platform.
Data correspond to usage on the plateform after 2015. The current usage metrics is available 48-96 hours after online publication and is updated daily on week days.
Initial download of the metrics may take a while.