Fig. 17
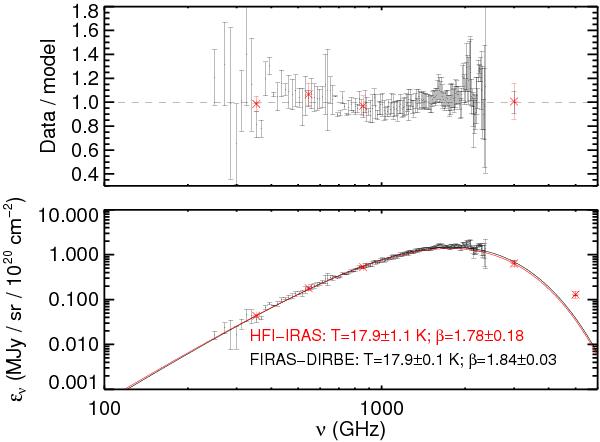
Bottom panel: black points show the FIRAS spectrum of the diffuse ISM (Compiègne et al. 2011). The red points are the average of the IRAS or Planck emissivities for the local components of all our fields; the uncertainty is the variance of the values divided by  . The solid curves are modified black body fits to each spectrum – the 5000GHz point was excluded from the fit as it is dominated by non-equilibrium dust emission. Top panel: same as bottom panel but each data set is divided by its modified black body fit.
Current usage metrics show cumulative count of Article Views (full-text article views including HTML views, PDF and ePub downloads, according to the available data) and Abstracts Views on Vision4Press platform.
Data correspond to usage on the plateform after 2015. The current usage metrics is available 48-96 hours after online publication and is updated daily on week days.
Initial download of the metrics may take a while.