Fig. 14
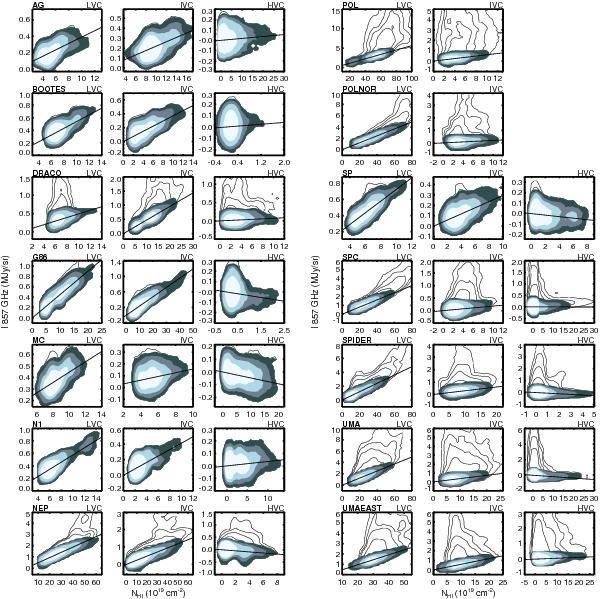
I857 vs. NHI scatter plots, visualising the dust-gas correlation for each of the three Hi components, across a row. The fields POL and POLNOR do not have an HVC component. For a given Hi component, the remaining 857GHz emission, once the contribution of the other two Hi components has been removed, is plotted as a function of NHI of that component (i.e., 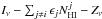 as a function of
  ). The contours show quartiles of the density of points in each scatter plot. The filled contours show the data points used in the correlation analysis (i.e., data points not masked out) while the open contours show all data points.
Current usage metrics show cumulative count of Article Views (full-text article views including HTML views, PDF and ePub downloads, according to the available data) and Abstracts Views on Vision4Press platform.
Data correspond to usage on the plateform after 2015. The current usage metrics is available 48-96 hours after online publication and is updated daily on week days.
Initial download of the metrics may take a while.