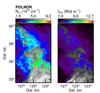
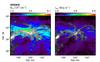
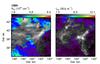
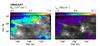
Fig. 13
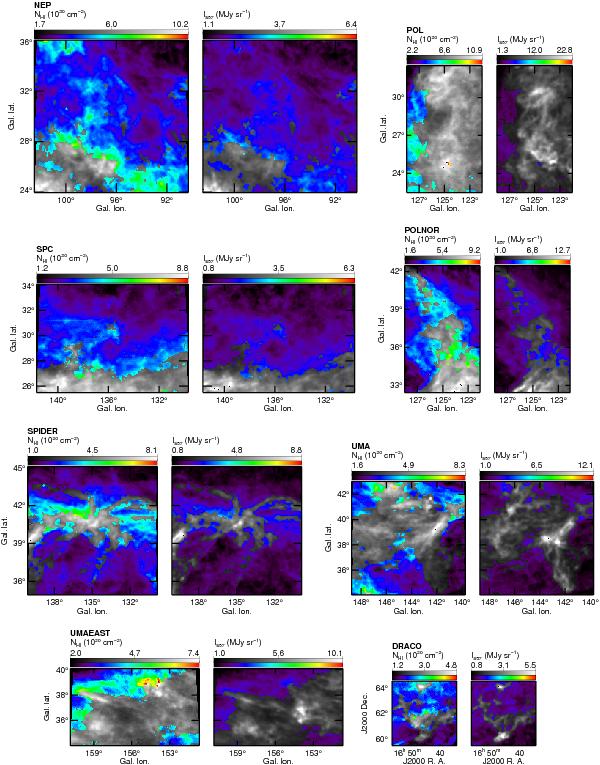
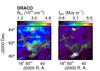
Mask for the eight fields where more than 1% of the pixels were excluded (NEP = 17%, POL = 83%, SPC = 26%, POLNOR = 30%, SPIDER = 24%, UMA = 56%, UMAEAST = 66%, DRACO = 29%). For each field the left image is the total Hi integrated emission and the right image is the Planck 857GHz map. The regions in greyscale were excluded from the correlation analysis. Note the relationship of the masks to the regions of high residual in Figs. 5 to 11.
Current usage metrics show cumulative count of Article Views (full-text article views including HTML views, PDF and ePub downloads, according to the available data) and Abstracts Views on Vision4Press platform.
Data correspond to usage on the plateform after 2015. The current usage metrics is available 48-96 hours after online publication and is updated daily on week days.
Initial download of the metrics may take a while.