Free Access
Fig. 12
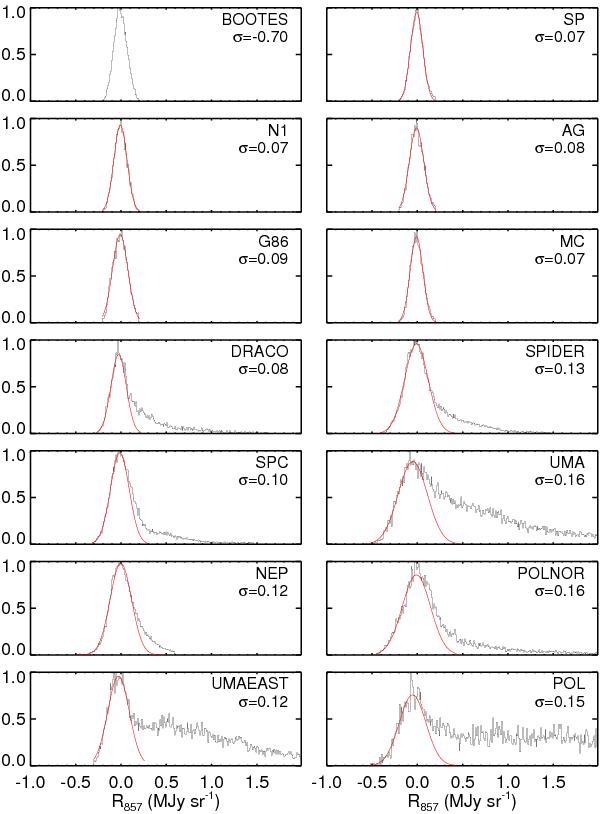
Normalised PDF of the residual R857 of the dust-gas correlation at 857GHz for each field after convergence of the masking procedure. The red curve is the result of a Gaussian fit to the lower, rising part of the PDF.
Current usage metrics show cumulative count of Article Views (full-text article views including HTML views, PDF and ePub downloads, according to the available data) and Abstracts Views on Vision4Press platform.
Data correspond to usage on the plateform after 2015. The current usage metrics is available 48-96 hours after online publication and is updated daily on week days.
Initial download of the metrics may take a while.