Fig.2
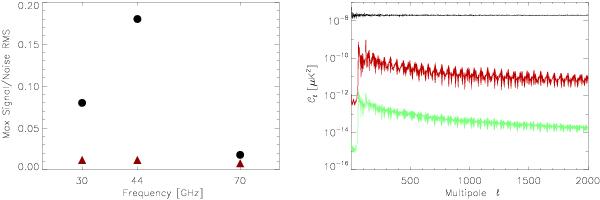
The effect of electronic spikes on the data. Left – Maximum pixel value in the simulated “spike” (black dots) and “spike-subtracted” maps (red triangles; see text), scaled to the local pixel noise. In our data processing, the square wave signal is subtracted only at 44GHz detectors. The black circles therefore represent the estimated highest spike signal level in the 30 GHz and 70GHz maps, while the red triangle represents the estimated highest residual spike signal level in the 44GHz map. Right – Angular power spectra of the 44 GHz simulations: the red (middle) line shows the power spectrum of the simulated spike map, and the green (bottom) line shows the power spectrum of the simulated spike-subtracted map. Subtraction reduces the power by a factor of about 100, from a small to an insignificant fraction of the white noise power, shown by the black (top) line.
Current usage metrics show cumulative count of Article Views (full-text article views including HTML views, PDF and ePub downloads, according to the available data) and Abstracts Views on Vision4Press platform.
Data correspond to usage on the plateform after 2015. The current usage metrics is available 48-96 hours after online publication and is updated daily on week days.
Initial download of the metrics may take a while.