Fig.4
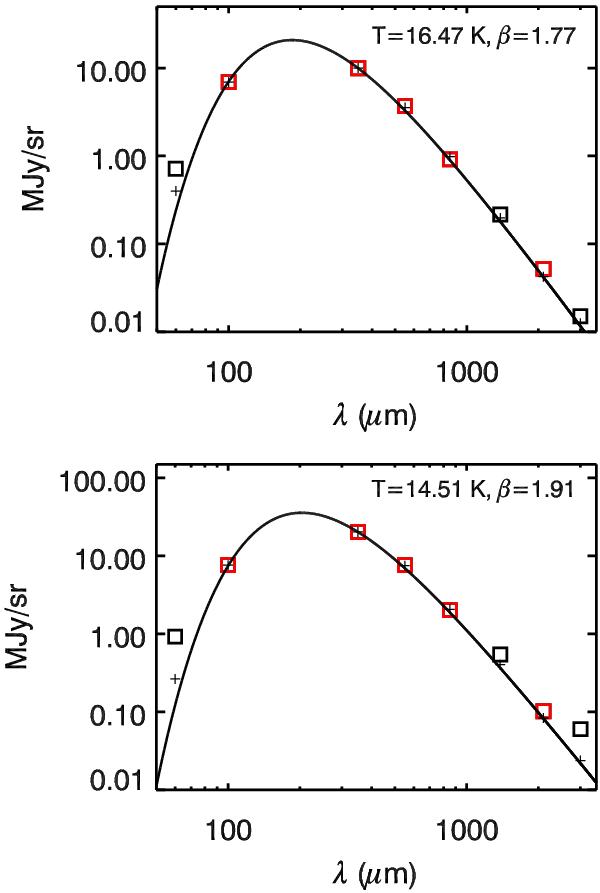
SED of two pixels (top: non-molecular region, bottom: molecular region). The squares are data, the solid line is the fitted model, and the crosses are the fitted model integrated within the bands. The fits are performed using the 100 μm, 857, 545, 353 and 143 GHz bands (red squares), and using the statistical noise discussed in Sect. 2, which is too low to be visible on the figure. Significant excess in the 217 and 100 GHz bands caused by 12CO and 13CO emissions are detected in the molecular spectrum. The 60 μm data points are not used to analyse the SEDbecause of the contribution of small dust particles transiently heated each time they absorb a UV/visible photon.
Current usage metrics show cumulative count of Article Views (full-text article views including HTML views, PDF and ePub downloads, according to the available data) and Abstracts Views on Vision4Press platform.
Data correspond to usage on the plateform after 2015. The current usage metrics is available 48-96 hours after online publication and is updated daily on week days.
Initial download of the metrics may take a while.