Fig.2
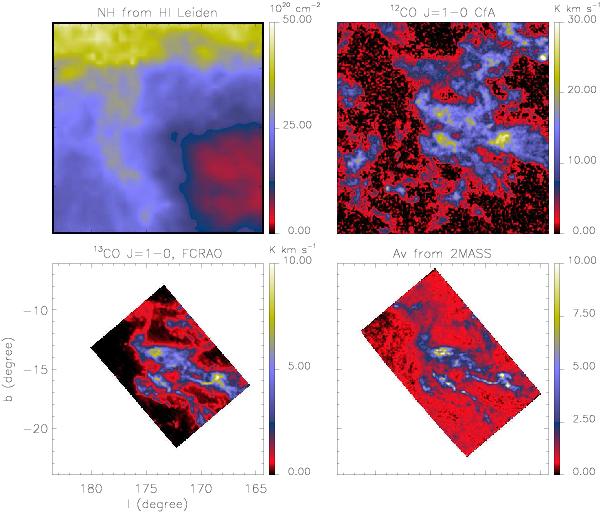
Upper left panel: column density derived from the Hi data at 21 cm (Hartmann & Burton 1997). Upper right panel: 12CO (J = 1 → 0) velocity integrated emission line (Dame et al. 2001). Lower left panel: 13CO J = 1 → 0 velocity integrated emission line (Narayanan et al. 2008; Goldsmith et al. 2008). Lower right panel: NIR extinction using 2MASS (Pineda et al. 2010). The 13CO and NIR extinction maps are smoothed at the angular resolution of the 143 GHz HFI band (FWHM: 7.08′).
Current usage metrics show cumulative count of Article Views (full-text article views including HTML views, PDF and ePub downloads, according to the available data) and Abstracts Views on Vision4Press platform.
Data correspond to usage on the plateform after 2015. The current usage metrics is available 48-96 hours after online publication and is updated daily on week days.
Initial download of the metrics may take a while.