Fig.A.1
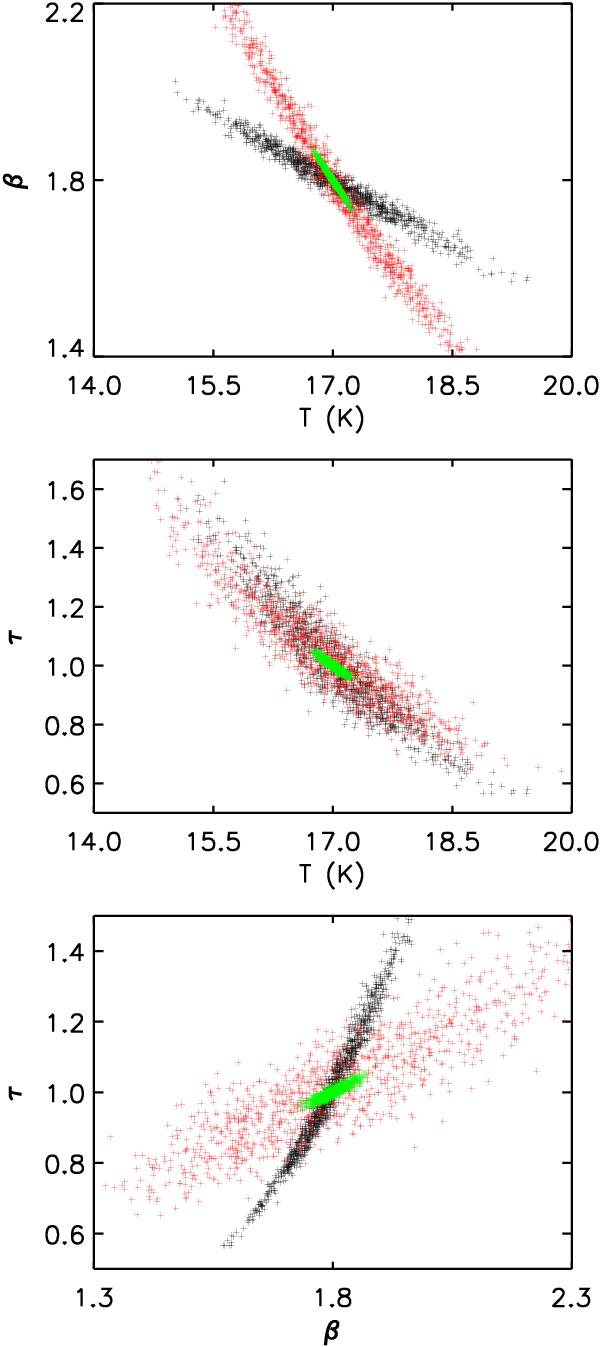
Correlation between the fitted values of T, β, and τ250 for 1000 simulated spectra at 100 μm 857, 545, and 143 GHz (350, 545, and 2100 μm) with T = 17 K, β = 1.8, and τ250 = 1: black, with systematic errors on the gains; red and green, with statistical noise and CIBA with I (100 μm) = 1 and 10 MJy sr-1, respectively. Relative values are given for τ250.
Current usage metrics show cumulative count of Article Views (full-text article views including HTML views, PDF and ePub downloads, according to the available data) and Abstracts Views on Vision4Press platform.
Data correspond to usage on the plateform after 2015. The current usage metrics is available 48-96 hours after online publication and is updated daily on week days.
Initial download of the metrics may take a while.