Free Access
Fig.11
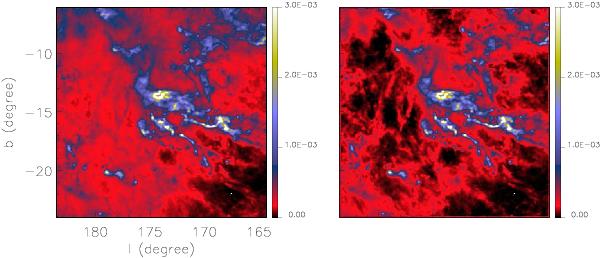
Maps of the dust optical depth at 250 μm (1200 GHz). Left panel: total optical depth derived from the pixel-by-pixel fit of the HFI and IRAS data. Right panel: optical depth map of the molecular phase alone (the optical depth associated with the atomic phase has been removed, see Sect. 5.3).
Current usage metrics show cumulative count of Article Views (full-text article views including HTML views, PDF and ePub downloads, according to the available data) and Abstracts Views on Vision4Press platform.
Data correspond to usage on the plateform after 2015. The current usage metrics is available 48-96 hours after online publication and is updated daily on week days.
Initial download of the metrics may take a while.