Free Access
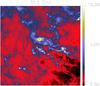
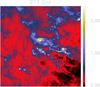
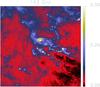
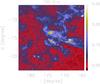
Fig.1
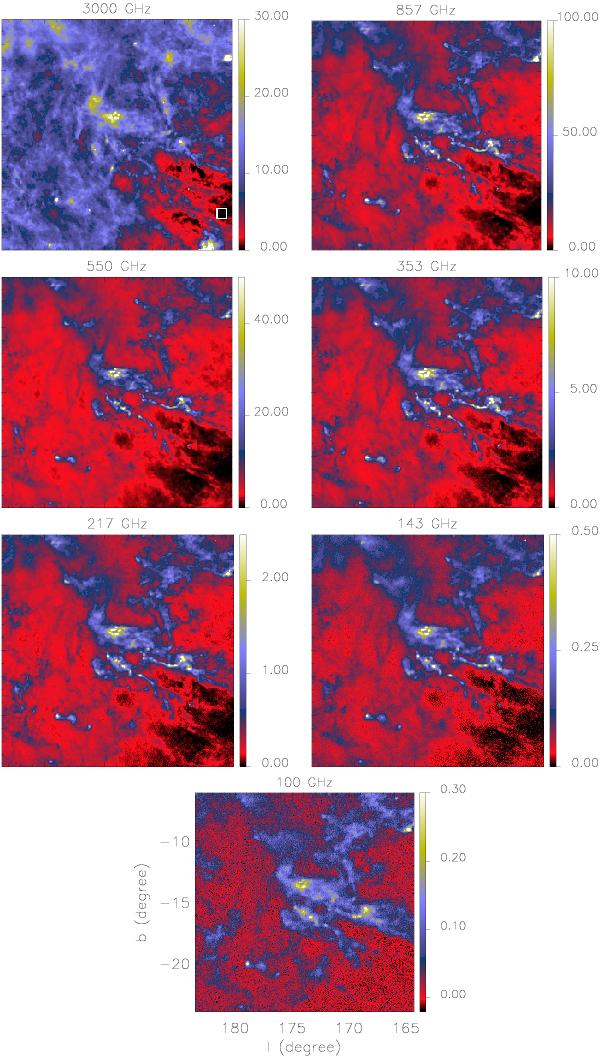
IRAS and HFI maps of the Taurus molecular cloud, in MJy sr-1. The 48′ × 48′ reference window is seen on the IRAS map at 100 μm (3000 GHz). For all maps the average brightness computed within the reference window is subtracted.
This figure is made of several images, please see below:
Current usage metrics show cumulative count of Article Views (full-text article views including HTML views, PDF and ePub downloads, according to the available data) and Abstracts Views on Vision4Press platform.
Data correspond to usage on the plateform after 2015. The current usage metrics is available 48-96 hours after online publication and is updated daily on week days.
Initial download of the metrics may take a while.