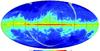
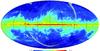
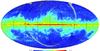
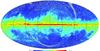
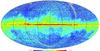
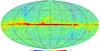
Fig.5

Maps of the dust optical depths on a log scale, in theIRAS100μm (first row left) and Planck- HFI bands at (first row right), (second row left), (second row right), (third row left), (third row right) and GHz (fourth row). All maps are shown in Galactic coordinates with the Galactic centre at the centre of the image. The missing data in all images correspond to theIRASgaps. The upper and lower bounds of the colour scale are set to τmin = 5 × 10⁻⁵ × (λ/100μm)-1.8 and τmax = 10-2 × (λ/100μm)-1.8 respectively.

Current usage metrics show cumulative count of Article Views (full-text article views including HTML views, PDF and ePub downloads, according to the available data) and Abstracts Views on Vision4Press platform.
Data correspond to usage on the plateform after 2015. The current usage metrics is available 48-96 hours after online publication and is updated daily on week days.
Initial download of the metrics may take a while.