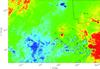
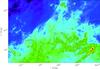
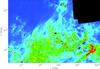
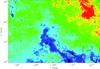
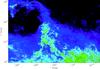
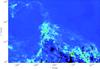
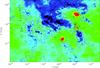
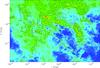
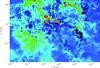
Fig.4
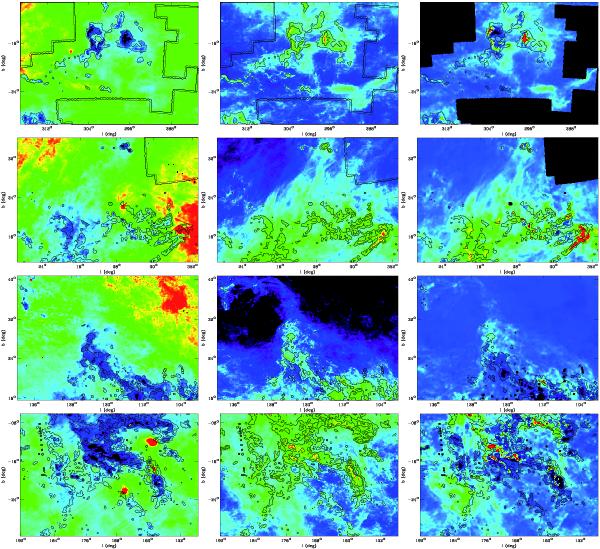
Details of the dust temperature (left column), dust optical depth at 857 GHz (central column) and dark gas column density (right column) for the Chamaeleon (first line), Aquila-Ophiuchus flare (second line), Polaris flare (third line) and Taurus (fourth line). The temperature and optical depth maps are shown in log scale with a colour scale ranging from 15K (black) to 20K (red) and 1 × 10⁻⁵ (black) to 3 × 10⁻³ (red) respectively. The dark gas column density derived from the optical depth at 857 GHz (see Sect.4) and is shown in linear scale with a colour scale ranging from –3 (black) to 7 × 10²¹Hcm-2 (red). The contours show the 12CO(J = 1 → 0) integrated intensity at 2, 10 and 20K km s-1. The double line shows the limit of the CO surveys.
Current usage metrics show cumulative count of Article Views (full-text article views including HTML views, PDF and ePub downloads, according to the available data) and Abstracts Views on Vision4Press platform.
Data correspond to usage on the plateform after 2015. The current usage metrics is available 48-96 hours after online publication and is updated daily on week days.
Initial download of the metrics may take a while.